
 Home
Home News
News
- 1 MU stock price showed a bearish market trend with over 3% price drop in the last 5 days.
- 2 With increased bears’ activity, MU stock price showed a price decline which recently experienced increased bulls’ dominance.
Micron Technology (MU) stock price experienced increased bearish activity last week which is now accumulating bulls. In the recent trading session, with 1.48% of price rise, MU stock showed bulls’ dominance. The stock price was trading near its 20-day moving average which then rose upwards with bull’s dominance.
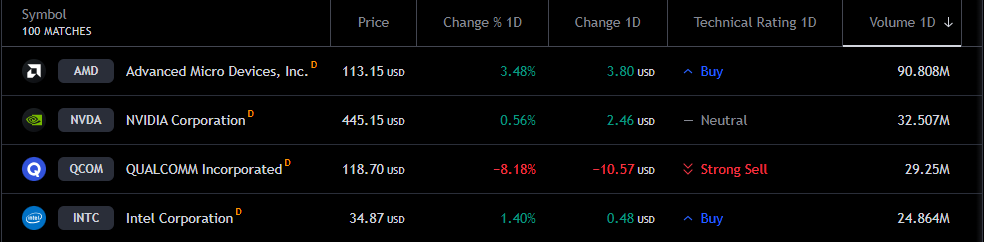
In the semiconductor industry stocks, Advanced Micro Devices Inc. (NASDAQ: AMD), NVIDIA Corp. (NASDAQ: NVDA), and Qualcomm Inc. (NASDAQ: QCOM) experienced the most volume activity in a day. These three stocks noted over 90 Million, 32 Million, and 29 Million in volume in the last day. Meanwhile, MU stock witnessed over 11 Million in volume.
MU Stock Price Analysis
On August 4, 2023, Thursday, MU stock opened at $67.57 with a 1.48% price rise and closed at $69.18. The day range of MU stock was between $69.39 to $67.16.
With the bullish trend, MU stock price traveled upside from its 20-day moving average. However, as compared to its previous week’s performance, MU stock dropped from nearly $71.00 to its recent closing price.
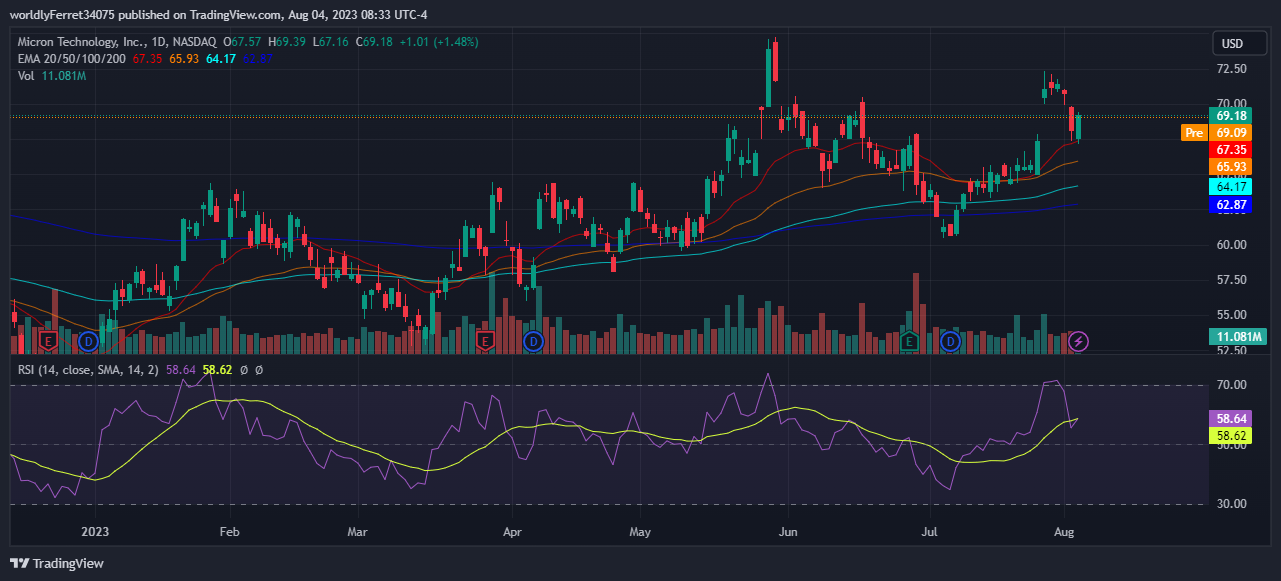
As the above chart shows, the RSI of MU share is once again trying to take an upside ride. Near the weekend, more price fluctuations can be seen that may change the picture of its previous trend.
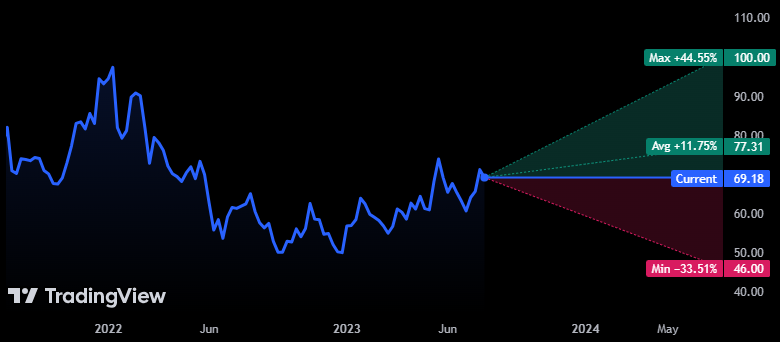
According to analysts, their one-year price target is at $77.31, up by over 11% from the recent closing of MU share. They have set their maximum estimate at $100.00 while the minimum estimate is at $46.00.
The Financial Update of Micron Technology
Micron Technology Inc. (NASDAQ: MU), a semiconductor manufacturing company, has a market cap of nearly $75 Billion. According to its recent quarter (Q3) 2023 report, the company’s net income is negative $1.90 Billion. MU price-to-sales ratio is 4.26 and the company has an Enterprise Value to EBITDA ratio of 15.26.
MU dividends are paid quarterly and the last dividend per share was $0.12, as of today, the Dividend Yield (TTM)% is 0.67%. Its Q3 2023 report states MU earnings per share (EPS) is negative $1.43 whereas the estimation was negative $1.61 which accounts for an 11.21% surprise.
The revenue for the same period amounts to $3.75 Billion despite the estimated figure of $3.65 Billion. The estimated EPS for the next quarter is negative $1.17, and revenue is expected to reach $3.88 Billion.
Micron Technology Inc. revenue for 2022 amounted to $30.76 Billion, the most of which — $13.69 Billion — came from its highest performing source at the moment, the “compute and networking business unit”.
Disclaimer
The views and opinions stated by the author, or any people named in this article, are for informational ideas only and do not establish financial, investment, or other advice. Investing in or trading crypto or stock comes with a risk of financial loss.

Andrew is a blockchain developer who developed his interest in cryptocurrencies while pursuing his post-graduation major in blockchain development. He is a keen observer of details and shares his passion for writing, along with coding. His backend knowledge about blockchain helps him give a unique perspective to his writing skills, and a reliable craft at explaining the concepts such as blockchain programming, languages and token minting. He also frequently shares technical details and performance indicators of ICOs and IDOs.


