
 Home
Home News
News
- 1 NKE stock price increased by 0.65% over the past seven days.
- 2 Nike Inc ( NYSE: NKE) stock’s 52-week price range is $82 – $131.
NIKE’s earnings and revenues have been growing faster than the Luxury industry, as shown by the data from the financial website Simplywall. NIKE’s earnings have been increasing by an average of 16.8% per year, while the Luxury industry’s earnings have been growing by 14.1% per year. NIKE’s revenues have also been rising by an average of 6.7% per year. NIKE has a high return on equity of 36.2%, which shows how well it uses its shareholders’ funds. NIKE also has a net margin of 9.9%, which shows how much profit it makes from its sales.
A possible way to rewrite and paraphrase your sentence is The financial website Simplywall provides some data on NIKE’s financial position. It shows that NIKE has a moderate debt-to-equity ratio of 63.8%, which means that NIKE has $0.64 of debt for every $1 of equity. NIKE’s total assets are $37.5 Billion, which is more than its total liabilities of $23.5 Billion. This means that NIKE has enough assets to cover its obligations. NIKE’s EBIT is $5.9 Billion, which makes its interest coverage ratio -985.8. This means that NIKE has negative interest expenses, which could indicate that it has a net cash position. NIKE has cash and short-term investments of $10.7 Billion, which shows that it has a strong liquidity position.
The market capitalization of Nike Stock is $166.487 Billion and the total revenue is $51.191 Billion. Moreover, the stock’s basic EPS is $3.26 and the price-to-earnings ratio is 33.66. Moreover, the average volume is 6.167 Million and the current volume is 5.621 Million, the current volume is below average volume.
Moreover, the Nike Stock has done well in the last month, increasing by 0.17% and plummeted by 14.18% in the last six months. However, Nike Inc (NYSE: NKE) stock has a negative year-to-date return of 8.22%.
Technical Analysis of Nike Stock Stock Price in 1-D Timeframe
The price action shows that Nike Inc’s ( NYSE: NKE) stock price has been on a declining trend for the last three months, decreasing by 13.59%. At the time of writing, NKE Stock is trading at $108.81 and has turned the trend after taking support by making higher highs and higher lows and rising by following trendline.
Therefore, if it maintains the current level, the NKE price could continue to move upward and reach the first and second targets of $114.42 and $120.67. However, if the NKE price fails to sustain the current level and drops, then it might hit the nearest support levels of $104.03 and $97.18.
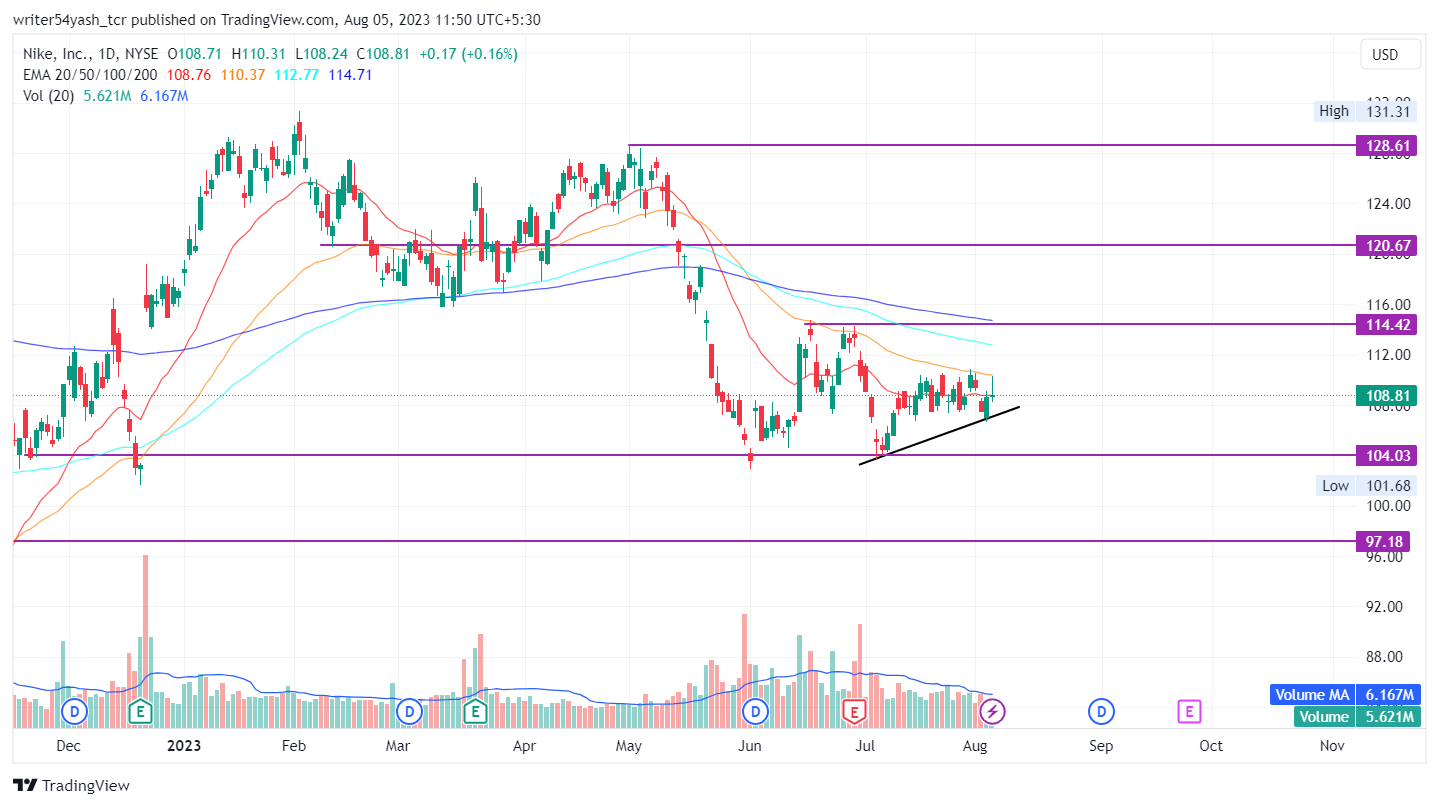
At the time of publishing, Nike Inc. (NYSE: NKE) is trading below the 50, 100, and 200-day EMA (exponential moving averages), which are rejecting the price trend.
However, 20-day EMA is supporting the trend if more buying volume adds up then the price might conquer rejecting EMA’s by making higher highs and lows.
Hence, NKE price is expected to move upwards giving bullish views over the daily time frame chart.

The current value of RSI is 49.45 points. The 14 SMA is above the median line at 49.01 points which indicates that Nike Stock is bullish as the RSI took 14 SMA support.
The MACD line at 0.2360 and signal line at 0.3687 are below the zero line and both lines are crossed in on each other. A bullish crossover is observed in the MACD oscillator which might signal more bullishness for the Nike Stock price.
Summary
Nike Inc (NYSE: NKE) indicates that the investors and traders of the stock price are bullish on the 1-D time frame. The price action reflects a bullish outlook at the time of publishing. The technical oscillators of the Nike Stock price also support the bullish trend. The MACD, RSI, and EMA are highlighting positive signals and imply that the uptrend may continue in Nike Stock price.
Technical Levels
- The nearest support levels for Nike Stock Price are $104.03 and $97.18.
- The nearest resistance levels for Nike Stock Price are $114.42 and $120.67.
Disclaimer
In this article, the views and opinions stated by the author, or any people named are for informational purposes only, and they don’t establish the investment, financial, or any other advice. Trading or investing in cryptocurrency assets comes with a risk of financial loss.

Andrew is a blockchain developer who developed his interest in cryptocurrencies while pursuing his post-graduation major in blockchain development. He is a keen observer of details and shares his passion for writing, along with coding. His backend knowledge about blockchain helps him give a unique perspective to his writing skills, and a reliable craft at explaining the concepts such as blockchain programming, languages and token minting. He also frequently shares technical details and performance indicators of ICOs and IDOs.


