
 Home
Home News
News

- 1 PXD stock surpassed the neckline of $220 and showed a breakout on the charts.
- 2 Buyers are attaining momentum and persist in accumulating the price.
Pioneer Natural Resource Company (PXD stock) shows the breakout of the symmetrical triangle pattern. The price surpassed the neutrality levels of $230. Moreover, the price action shows a trend reversal from the lows of $180; fresh buying momentum is noted on the charts.

However, the price is near the prompt hurdle of $235, which, if broken, would lead to a massive rally toward $250. Moreover, the rounding bottom pattern was noted, suggesting that buyers have made a base near $200. Afterward, buyers accumulated the price and gained momentum, and the price is now on the verge of entering bullish territory.

Moreover, the charts favor the bulls and suggest buyers are gaining traction and sellers who were trapped were covering their positions due to the recent breakout. The trajectory shows that PXD stock is trading above the key moving averages and forming a long-legged doji followed by a bullish candle which shows that buyers have taken control and are going to exceed the rally toward $250.
Pioneer Natural Resources Co. is an independent oil and gas exploration and production company. The firm engages in hydrocarbon exploration in the Cline Shale. It focuses on the operation of the Permian Basin, Eagle Ford Shale, Rockies, and West Panhandle projects. The company was founded by Scott Douglas Sheffield on April 2, 1997, and is headquartered in Irving, TX.
At press time, PXD stock price is trading at $234.06 with an intraday gain of 1.77% showing bullishness on the charts. Moreover, the trading volume remained at 2.046 Million, and the market cap is $54.569 Billion. Analysts maintained a buy and outperform rating with a yearly target price of $250.72.
PXD Stock Price Action On Daily Charts
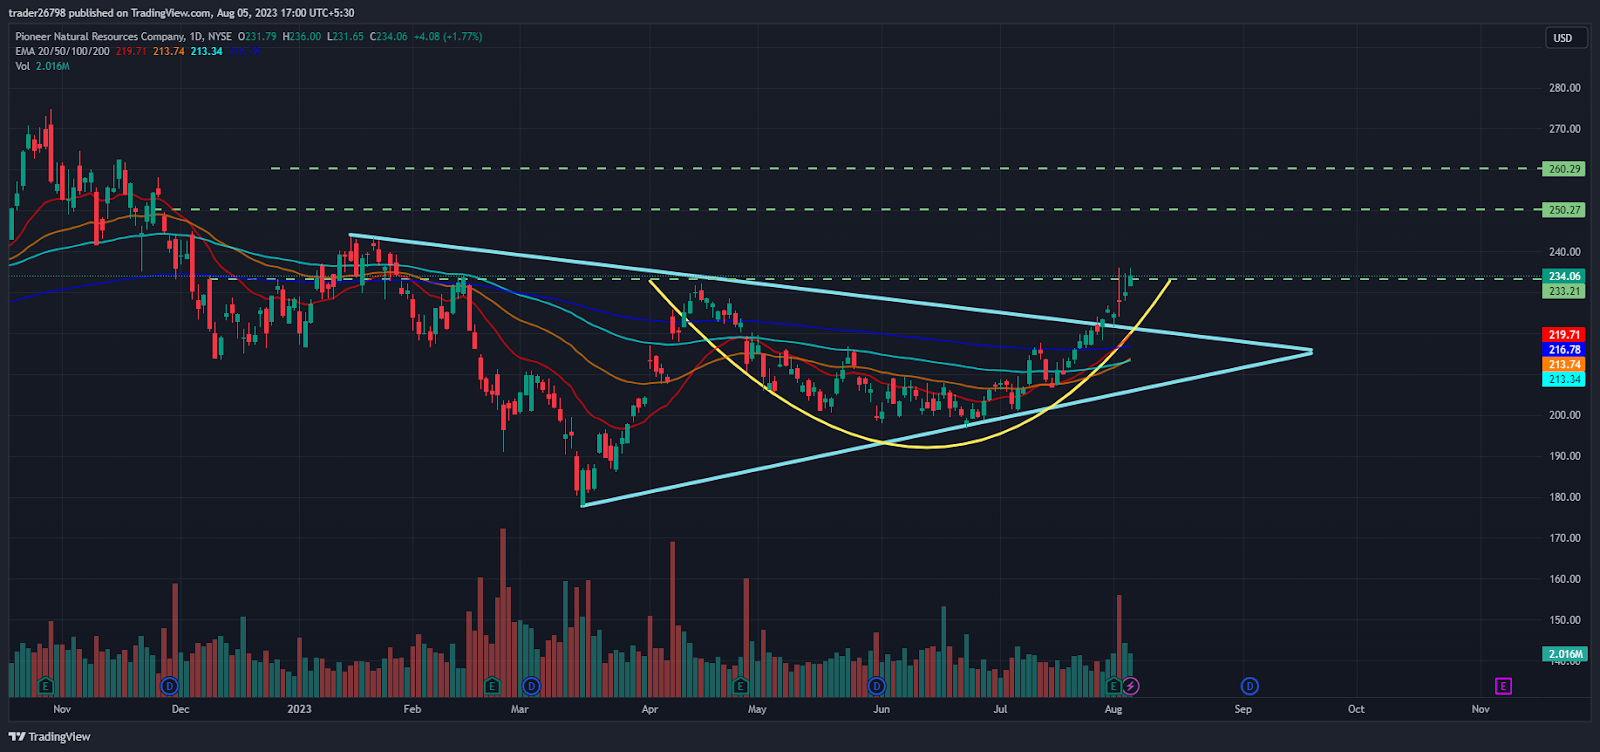
On the daily charts, PXD stock has formed a rounding bottom pattern and is near the neckline of $235, which, if surpassed decisively, will lead to a massive rally in the following sessions. Moreover, the buyers have attained momentum and rescued the gains from the round spot of $200 in the past sessions.
In the past months, PXD stock was in a corrective phase and showed a fall from the highs of $290 and corrected over 38% to the support of $180.
Short Term Charts Shows Buyers’ Strength On Charts

On the 4-hour charts, PXD stock price was riding the gains and showed accumulation in the past sessions.
The RSI curve stayed in the overbought zone and formed a positive crossover suggesting a positive outlook on the charts.
The MACD indicator showed a bullish crossover and persisted in forming green bars on the histogram, indicating the buyers’ dominance.
Conclusion
Pioneer Natural Resource Company (PXD stock) is gaining momentum and is close to the immediate resistance of $235. Moreover, the price action suggests a rise toward the round spot of $250 in the following sessions. However, there are further hurdles that might be challenging for the buyers.
Technical Levels:
Support Levels: $215 and $200
Resistance Levels: $250
Disclaimer
The views and opinions stated by the author, or any people named in this article, are for informational purposes only and do not establish financial, investment, or other advice. Investing in or trading crypto assets comes with a risk of financial loss.

Andrew is a blockchain developer who developed his interest in cryptocurrencies while pursuing his post-graduation major in blockchain development. He is a keen observer of details and shares his passion for writing, along with coding. His backend knowledge about blockchain helps him give a unique perspective to his writing skills, and a reliable craft at explaining the concepts such as blockchain programming, languages and token minting. He also frequently shares technical details and performance indicators of ICOs and IDOs.


