
 Home
Home News
News
- 1 SHIB price showed a massive breakout in the last session.
- 2 Buyers gained momentum and escaped above the 200-day EMA barrier.
Shiba Inu. (SHIB) price gave a much-awaited move, surpassed the major hurdle of $0.000009000, and registered a range breakout in the last sessions. Moreover, the bulls are gaining traction and looking to fetch $0.000010000, which buyers are willing to attain.
Furthermore, SHIB price action is now favoring bulls, and surpassing 200-day EMA gave firm conviction that bulls have attained momentum and sellers were trapped.
The price action shows that SHIB price has consolidated and been in a narrow range for the past weeks, where buyers attempted to leave the cage and looked for a breakout. Their dream came true as the coin surpassed the major hurdle above the key moving averages with a volume spike.
At press time, the SHIB coin price is trading at $0.000009580 with a massive intraday gain of 5.27%, showing a breakout on the charts. Moreover, the trading volume increased by 15.63% to $1.05 Billion. The market cap of the SHIB coin is $5.64 Billion.
SHIB coin price has surpassed the upper trendline and showed fresh buying in the last session. Moreover, the SHIB coin formed a bullish Marubozu candlestick on the charts indicating the presence of mighty bulls who made long build-ups and were willing to exceed the gains toward the round spot of $0.000010000.
In the past months, Shiba Inu. price has shown correction from the top and retested the demand zone of $0.00000550 and accumulated from the base. SHIB coin price has shown a trend reversal and surpassed the crucial 200-day EMA.
SHIB Price Action On Daily Charts
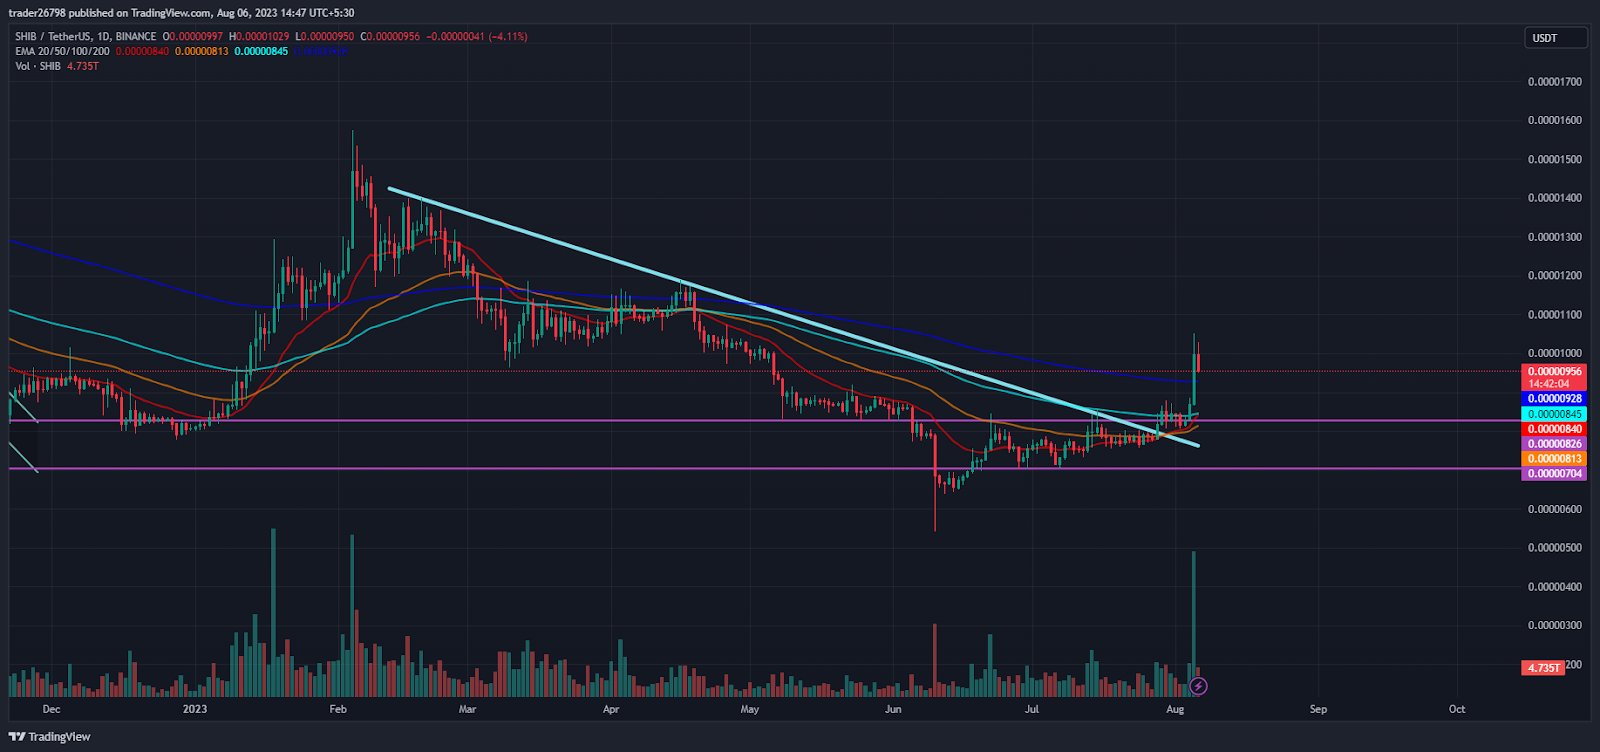
On the daily charts, SHIB price has broken out of the upper trendline and showed signs of a fresh bullish move for the following sessions. If the price rises above the 200-day EMA, a further bullish move will lead the price toward the trajectory of $0.00001000, followed by $0.00001100. Moreover, the coin is gaining strength, indicating a bull move and suggesting a follow-on rise for the upcoming sessions.
As per the Fib levels, the Shiba Inu coin price has surpassed 38.2%, and heading towards neutrality shows signs of a trend reversal. Moreover, the price is near the upper Bollinger band.
Short-Term Charts Indicating Buyers’ Dominance
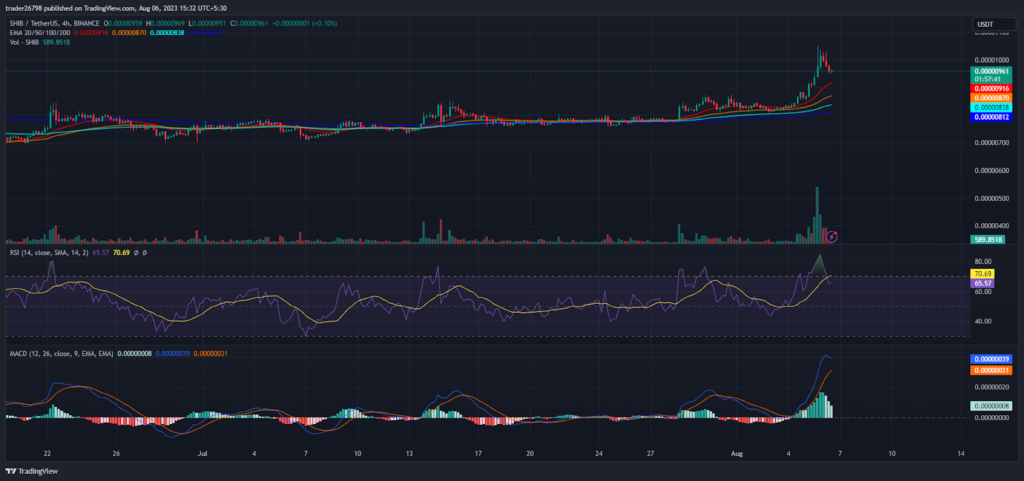
On the 4-hour charts, the Shiba Inu coin price had a massive bull move, broking the range above the neckline of $0.000009000.
The RSI curve sharply rose toward the overbought zone and formed a positive crossover indicating massive bullishness on the charts.
The MACD indicator showed a bullish crossover and formed the green bars on the histogram, signaling buyers’ dominance on the charts.
Conclusion
Shiba Inu. (SHIB) coin attained momentum and showed a range breakout on the charts signaling buyer dominance. Moreover, the price action signals a rise toward the round mark of $0.000010000 in the upcoming sessions.
Technical Levels:
- Support Levels: $0.000009000 and $0.000008500
- Resistance Levels: $0.000010000
Disclaimer
The views and opinions stated by the author, or any people named in this article, are for informational purposes only and do not establish financial, investment, or other advice. Investing in or trading crypto assets comes with a risk of financial loss.

Andrew is a blockchain developer who developed his interest in cryptocurrencies while pursuing his post-graduation major in blockchain development. He is a keen observer of details and shares his passion for writing, along with coding. His backend knowledge about blockchain helps him give a unique perspective to his writing skills, and a reliable craft at explaining the concepts such as blockchain programming, languages and token minting. He also frequently shares technical details and performance indicators of ICOs and IDOs.


