
 Home
Home News
News
- 1 AGNC Investment Corp’s stock price is currently trading at $9.91 with a drop of 2.06% in the last 24 hours.
- 2 AGNC has a current market cap of $6.006 Billion.
AGNC Investment Corp is a real estate investment trust. Company services include a variety of mortgages related to residential and commercial. The company was introduced on 7 January 2008.
Currently, the AGNC stock price is taking support on the $9.70 level and 200 SMA. Now share price heading towards 50 SMA. However, the price made a higher high and moved in an upward direction for a few weeks and now take a pause and moved downward.
Technical Analysis of AGNC Investment Corp Stock Price in 1-D Timeframe
AGNC Investment Corp ( NASDAQ: AGNC) has seen its stock price rise steadily for the past three months, gaining 5.3%. Currently, AGNC stock is trading at $9.91% and has been trying to hold on to this level after a pullback.
If it can keep this level, the AGNC Investment Corp price could continue to go up and reach the first and second targets of $10.65 and $10.87. However, if the AGNC price cannot maintain this level and falls, then it might hit the closest support levels of $9.70 and $9.33.
At the time of publishing, AGNC Investment Corp stock (NASDAQ: AGNC) is trading above the 200-day SMA (Simple moving averages) and heading towards 50 SMA, which is supporting the price trend.
However, if selling volume adds up then the price might conquer supporting SMA’s by making lower highs and lows. Hence, the AGNC price is expected to move downwards giving bearish views over the daily time frame chart.
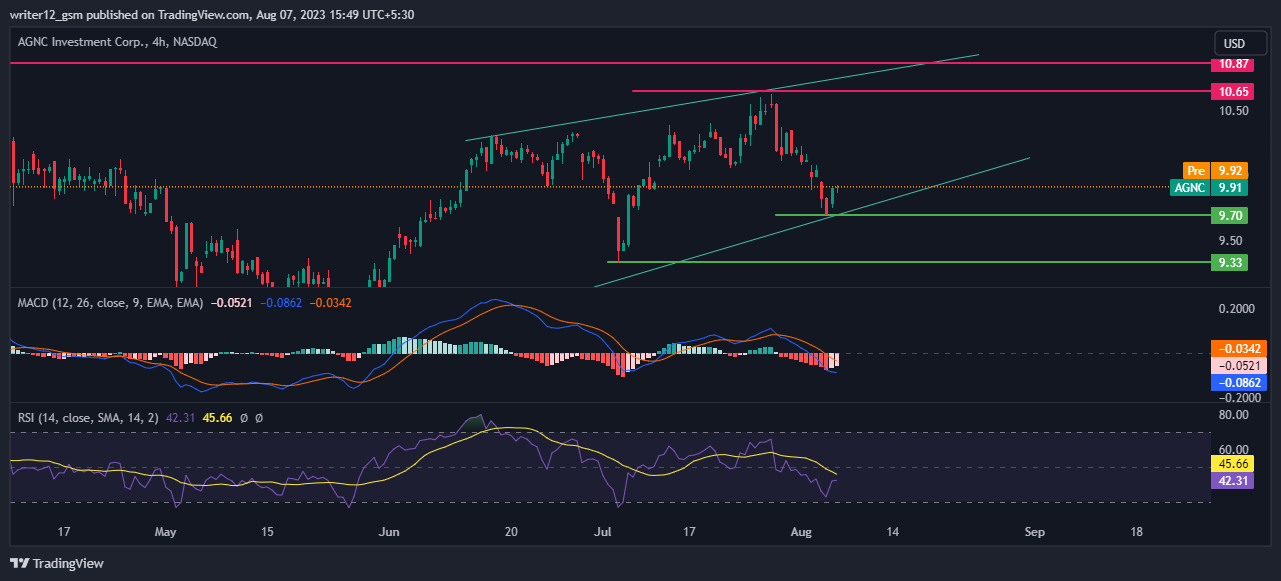
The MACD line at -0.0862 and the signal line at -0.0342 are above the zero line. A bearish crossover is observed in the MACD indicator which signals more bearishness for the AGNC stock price.
The current value of RSI is 42.31 points. The 14 SMA is above the median line at 45.66 points which indicates that the AGNC Investment Corp stock is bearish.
Summary
AGNC Investment Corp (NASDAQ: AGNC) suggests that the investors and traders of the share price are bearish on the 1-D time frame. The price action reflects a bearish perspective at the moment. The technical oscillators of the AGNC stock price also support the bearish trend. The MACD, RSI, and EMA are emphasizing negative signs and imply that the downtrend may continue in the AGNC stock price.
Technical Levels
- Support Levels: The nearest support levels for the AGNC Investment Corp stock price are $9.70 and $9.33.
- Resistance levels: The nearest resistance levels for the AGNC stock price are $10.65 and $10.87.
Disclaimer
The analysis provided in this article is for informational and educational purposes only. Do not rely on this information as financial, investment, or trading advice. Investing and trading in stock involves risk. Please assess your situation and risk tolerance before making any investment decisions.

Andrew is a blockchain developer who developed his interest in cryptocurrencies while pursuing his post-graduation major in blockchain development. He is a keen observer of details and shares his passion for writing, along with coding. His backend knowledge about blockchain helps him give a unique perspective to his writing skills, and a reliable craft at explaining the concepts such as blockchain programming, languages and token minting. He also frequently shares technical details and performance indicators of ICOs and IDOs.


