
 Home
Home News
News
- 1 Kava price (KAVA) surged 0.52% in the last 24 hours and is currently trading at $0.844.
- 2 Kava (KAVA) derivatives data states that a total of $293.41 open interest contracts have been created over the past 24 hours.
Kava (KAVA) is a next-generation blockchain that leverages Cosmos and Ethereum technologies to offer fast, interoperable, and developer-friendly solutions. Kava’s resources are optimized for protocol growth, powered by its Cosmos EVM that enables high scalability, speed, security, and support. Kava Rise is a $750M developer incentive fund that rewards the best protocols on Kava monthly based on usage.
The Kava price is trading at $0.844 with an incline of 0.52% in the past 24 hours. KAVA holds a total market cap of $572.1 Million and ranks 65th in the crypto market.
KAVA token has a trading volume of $8.36 Million with a decline of 37.6% over the past 24 hours. It has over 677.43 Million tokens in circulating supply. The volume-to-market cap ratio of the KAVA token is 1.47% indicating low volatility in the market.
Kava Price Prediction Using Price Action Strategy
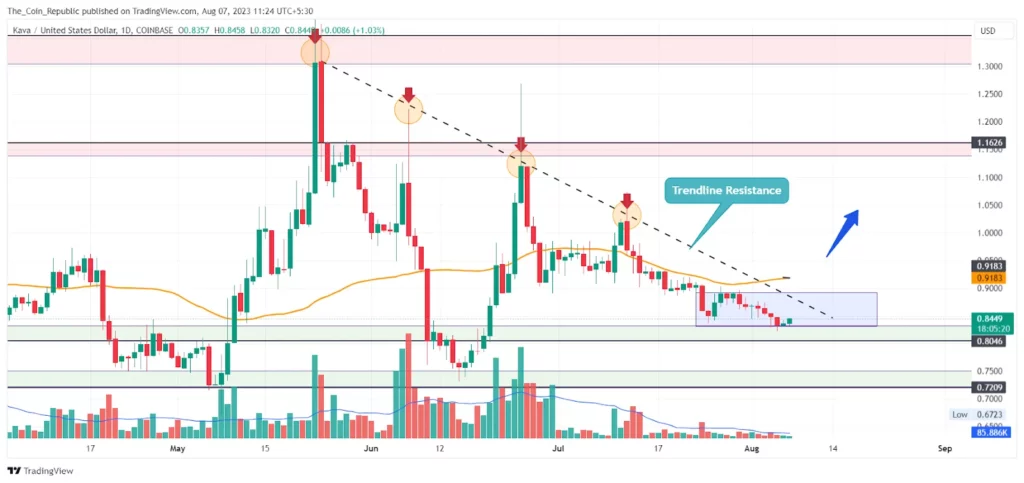
Kava price analysis reveals that the token has been in a correction phase after a hike of nearly 50% in May 2023. Since June 2023, the price has declined, suffering multiple rejections from trendline resistance, thus forming a descending triangle pattern.
The price has corrected by more than 3% in the past week and over 10% in the past month, showing the continuation of the correction phase. Also, the low volume of the coin further adds confirmation of the weakness in the stock.
Currently, the price is nearing a possible demand zone from where it may get the buyers’ support followed by a hike in the price, which may lead to a breakout.
Now, if the price sustains and breaks the trendline resistance, it may shift its trend to bullish and surge higher.
KAVA Price Forecast from Indicators’ point of view
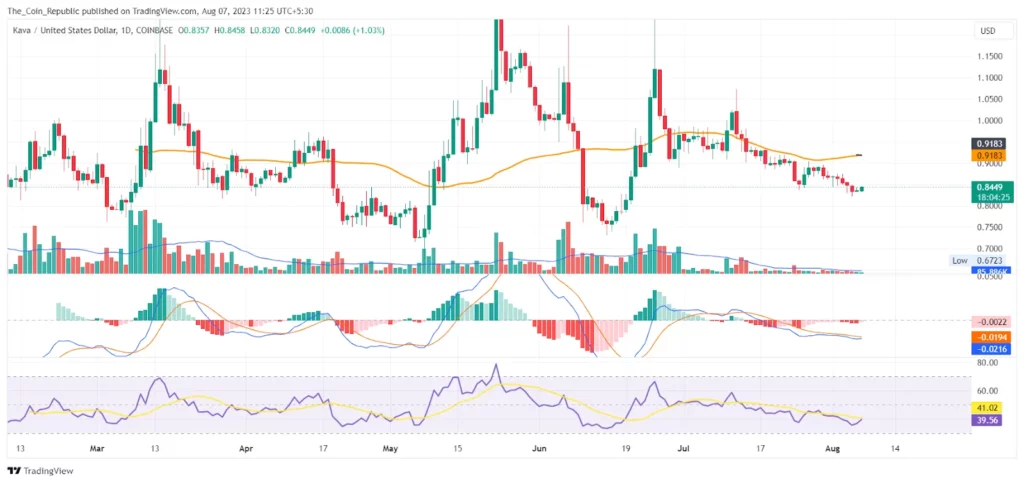
As per the EMA analysis, the KAVA price is trading below 50 and 200 EMA, indicating a bearish long-term and short-term sentiment.
At the time of publishing, the RSI value of the KAVA token is 36.96, and that of the SMA line is 40.84. RSI is declining, suffering rejection from the SMA line, which signals a bearish sentiment in the market.
MACD lines have made a bearish crossover. Also, Histogram bars are being formed below the mean line with increasing height, indicating a bearish sentiment in the market.
Conclusion
Kava price prediction concludes that the token has been corrected after a big rise in May 2023. The price has been falling and facing resistance from a trendline, forming a descending triangle pattern. The price may bounce back from a demand zone and break out of the resistance, changing the trend to bullish. Also, the indicators are signaling a mixed to bearish sentiment at the current moment.
Technical Levels
- Support levels: $0.838 and $0.720.
- Resistance levels: $0.1.16 and $1.35.
Disclaimer
The views and opinions stated by the author, or any people named in this article, are for informational purposes only and do not establish financial, investment, or other advice. Investing in or trading crypto or stock comes with a risk of financial loss.

Andrew is a blockchain developer who developed his interest in cryptocurrencies while pursuing his post-graduation major in blockchain development. He is a keen observer of details and shares his passion for writing, along with coding. His backend knowledge about blockchain helps him give a unique perspective to his writing skills, and a reliable craft at explaining the concepts such as blockchain programming, languages and token minting. He also frequently shares technical details and performance indicators of ICOs and IDOs.


