
 Home
Home News
News
- 1 The DYDX coin’s price decreased by 0.99% over the last 24 hours.
- 2 The price of DYDX coin is trading at $2.010 and the 52-week range is $1.090 – $3.542.
DYDX (DYDX) has a fully diluted valuation (FDV) of $2,088,845,183, according to the crypto data and information website Coingecko. This is a hypothetical market cap, assuming all 1 Billion DYDX tokens are circulating today. However, the actual FDV may take years to reach, depending on how the DYDX tokens are distributed over time.
As per Coinmarketcap, DYDX Crypto surged by 1.94% in market value and by 24.60% in trading volume in the last 24 hours. Its market value is $325,442,387 and its trading volume is $42,042,653. There are 156,256,174 DYDX in circulation.

DYDX coin’s (DYDX) open interest is $40.04 Million. As per Coinglass, another crypto analysis website, it rose by 4.24% in the previous session. The long versus short ratio for 24 hours is 1.0133. The total number of short positions added in the last 24 hours is $29.14 K against longs of $119.14 K.
DYDX Coin Price Technical Analysis in the 1-Day Timeframe
DYDX coin price has been on a downward trend for the past month, decreasing by 3.18% during this period. At the time of publication, DYDX Coin price is trading at $2.010, and the price is facing resistance and declining by making lower lows and highs.
Therefore, the DYDX coin price could continue to move downwards and reach the first and second targets of $1.492 and $1.086. If it fails to maintain the current level. However, if the DYDX Coin price sustains the current level and rises, then it might hit the nearest resistance levels of $2.375 and $2.915.
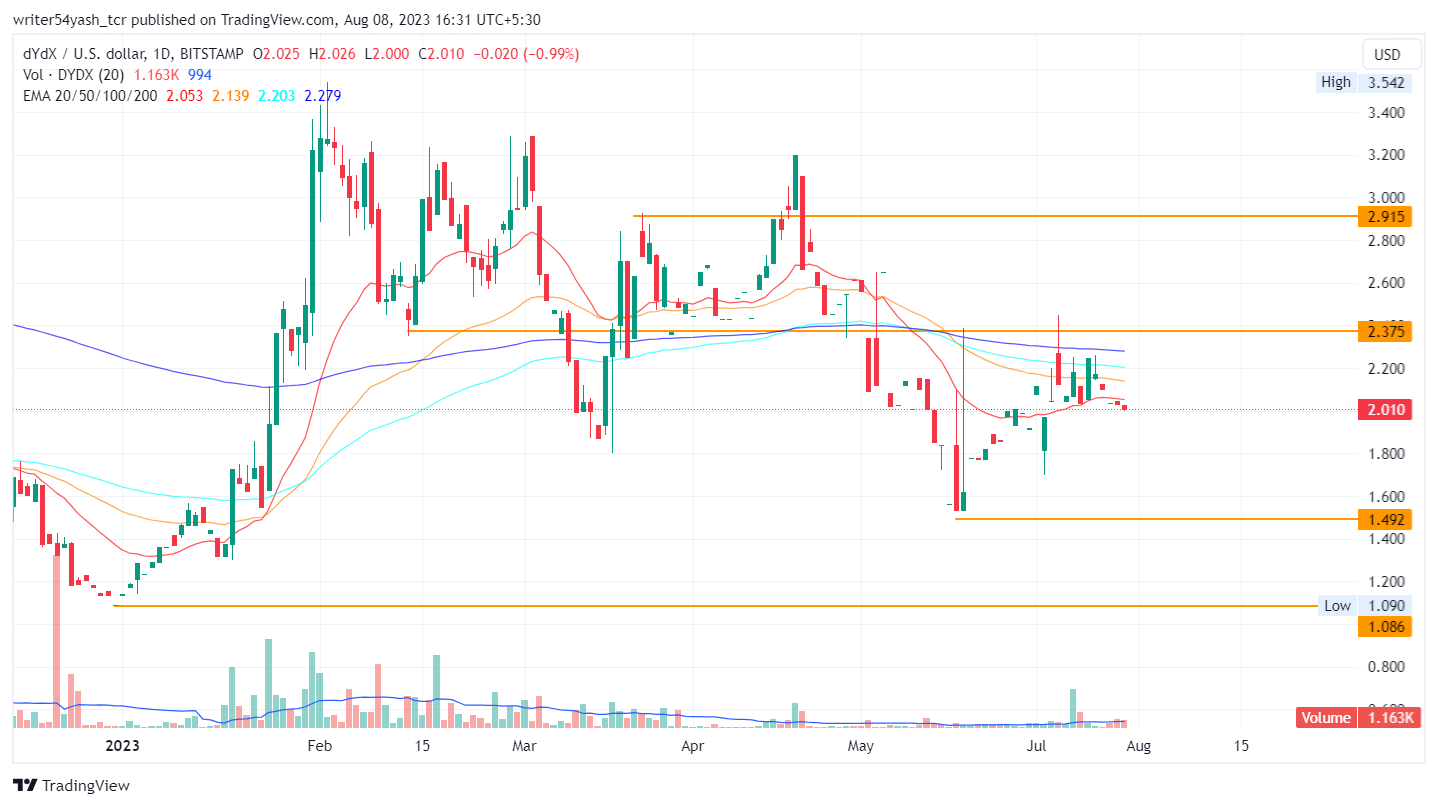
At the time of publishing, the DYDX coin price (BITSTAMP: DYDX) is trading below the 20, 50, 100, and 200-day EMAs (exponential moving averages), which are rejecting the DYDX Coin price trend. Hence, DYDX Coin price prediction estimates the prices to move downwards, indicating a bearish outlook over the daily time frame chart for its price.
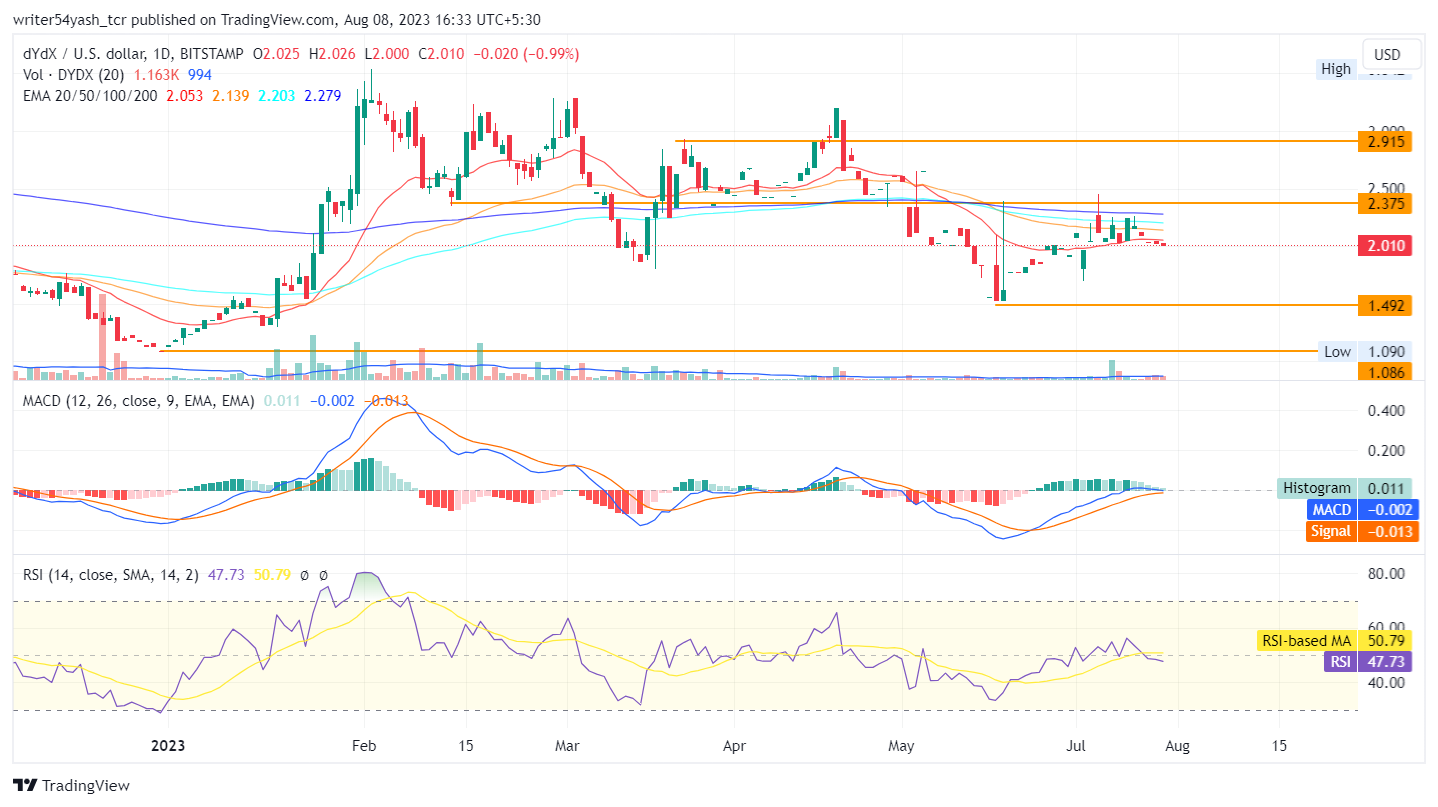
The MACD line at 0.002 and the signal line at 0.013 is below the zero line and both lines are narrowed in on each other and a bearish crossover is anticipated next in the MACD oscillator, suggesting bearish signals. The current value of RSI is 47.73 points and the 14-day SMA is at the median line at 50.79 points, which indicates a downward direction and bearish sentiments in the market for the DYDX coin.
Conclusion
DYDX coin price prediction highlights the bearish sentiments and perspectives of investors and traders regarding the DYDX token in the daily time frame. DYDX price action highlights a pessimistic view at the time of publishing. Moreover, the technical parameters of the DYDX price suggest the continuation of the downtrend over the daily time frame chart. Major trustworthy indicators MACD, RSI, and EMA, provide negative signals regarding the DYDX coin price.
Technical Levels:
- Support levels: The nearest support levels are $1.492 and $1.086.
- Resistance levels: The nearest resistance levels are $2.375 and $2.915.
Disclaimer
In this article, the views and opinions stated by the author, or any people named are for informational purposes only, and they don’t establish the investment, financial, or any other advice. Trading or investing in cryptocurrency assets comes with a risk of financial loss.

Nancy J. Allen is a crypto enthusiast, with a major in macroeconomics and minor in business statistics. She believes that cryptocurrencies inspire people to be their own banks, and step aside from traditional monetary exchange systems. She is also intrigued by blockchain technology and its functioning. She frequently researches, and posts content on the top altcoins, their theoretical working principles and technical price predictions.


