
 Home
Home News
News
- 1 FedEx Corporation’s stock price is currently trading at $268.26 with a drop of 1.48% in the last 24 hours (press time).
- 2 FDX has a market cap of $ 67.383 Billion.
FedEx making a higher high structure and keeping the momentum high. By evaluating the price data of the FedEx Corporation Stock, it can be said that it is in an uptrend presently. We can say that FDX is performing well right now. From its 52-week bottom price of $141.92, it increased to a $269.91 peak price.
FDX stock gives some excellent returns to investors. The current market sentiments are very positive about the stock. The average 3 months volume in FedEx Corporation is $2.09 Million. Buyers are showing interest in the stock in the present market scenario.
Technical Analysis of FedEx Corporation Stock Price in 1-D Timeframe
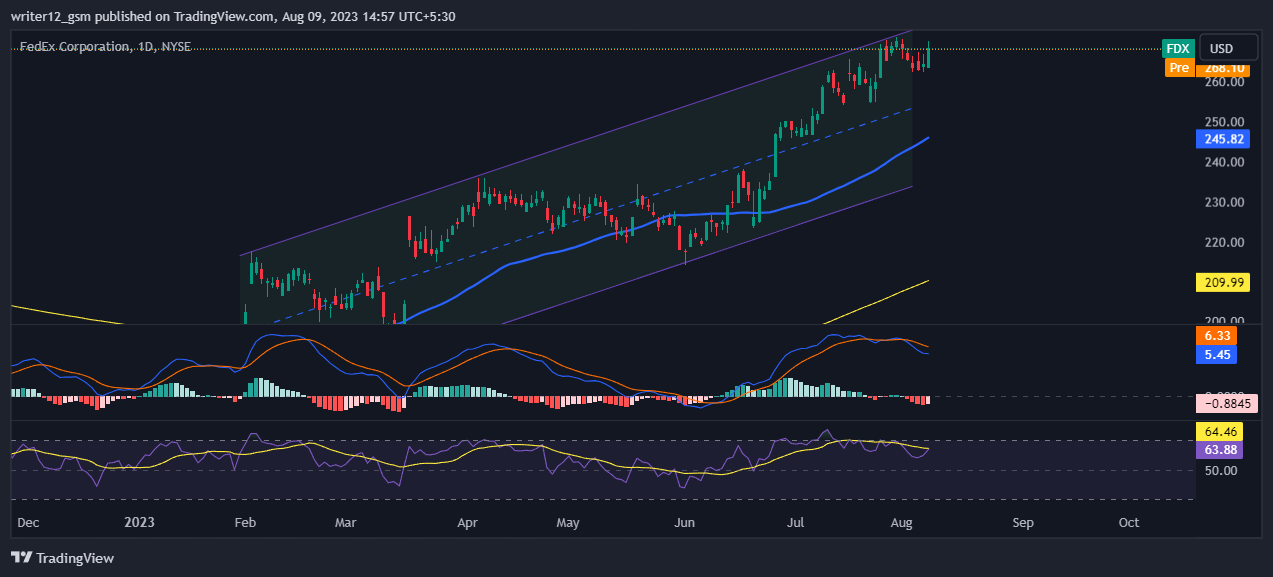
FedEx Corporation (NYSE: FDX) has steadily seen its stock price rise for the past three months, gaining 16.80% and 8.70% in the last month. Currently, FDX stock is trading at $268.26 and has been trying to hold on to this level after an unexpected surge in price.
If it can keep this level, the FedEx Corporation price could continue to go up and reach the first and second targets of $271.30 and $282.30. However, if the FDX price cannot maintain this level and falls, then it might hit the closest support levels of $251.00 and $226.00.
Currently, FedEx Corporation stock (NYSE: FDX) is trading above the 50 and 200-day simple moving averages, which are supporting the price momentum.
The current value of RSI is 63.88 points. The 14 SMA is above the median line at 64.46 points which indicates that the FedEx Corporation stock is bullish.
The MACD line at 5.45 and the signal line at 6.33 are above the zero line. A bearish crossover is observed in the MACD indicator which signals weakness in the momentum of the FDX stock price.
Summary
FedEx Corporation (NYSE: FDX) suggests that the investors and traders of the share price are bullish on the 1-Day time frame. The price action reflects a bullish perspective at the moment. The technical oscillators of the FDX stock price also support the bullish trend. The MACD, RSI, and EMA are emphasizing positive signs and imply that the uptrend may continue in the FDX stock price.
Technical Levels
- Support Levels: $223.00 and $208.00.
- Resistance levels: $242.00 and $248.00.
Disclaimer
The analysis provided in this article is for informational and educational purposes only. Do not rely on this information as financial, investment, or trading advice. Investing and trading in stock involves risk. Please assess your situation and risk tolerance before making any investment decisions.

Nancy J. Allen is a crypto enthusiast, with a major in macroeconomics and minor in business statistics. She believes that cryptocurrencies inspire people to be their own banks, and step aside from traditional monetary exchange systems. She is also intrigued by blockchain technology and its functioning. She frequently researches, and posts content on the top altcoins, their theoretical working principles and technical price predictions.


