
 Home
Home News
News

- 1 GME stock price is presently below multiple moving averages.
- 2 The RSI curve shows a bearish divergence indicating selling pressure.
GameStop (GME stock) price showed a breakdown and fell below the lower trendline of the ascending triangle pattern on the charts. However, GME stock held the gains near $20 and attempted a bounce. The charts justified that GME stock price has retraced to fill the pending gap near $20.
However, if GME stock sustains above $20, it could revisit the trendline at $25. The technicals suggest a reversal if it surpasses it in the following sessions. However, the trading volume was average, showing profit booking in the stock.

GME stock price action shows that it has been consolidating in a narrow range for the past months amid positive sentiments. However, buyers tried to escape the range, leading to a fake breakout near $28. Afterward, GME stock showed correction and retested the demand zone in the last session.
At press time, GME stock price is trading at $20.74 with an intraday drop of 1.74% showing selling pressure in yesterday’s session. Moreover, the trading volume remained at 1.454 Million, and the market cap is $6.321 Billion.
However, analysts have downgraded the stock and maintained a sell rating with a target price of $13.00, which resulted in selling pressure in the past sessions.
About GameStop (GME Stock):
GameStop Corp. offers games and entertainment products through its e-commerce properties and stores. It operates through the following geographical segments: United States, Canada, Australia, and Europe. Each segment consists primarily of retail operations, including stores and e-commerce properties focused on games, entertainment products, and technology.
GameStop offers new and pre-owned gaming platforms from the major console and PC manufacturers, sells new and pre-owned gaming software for current and specific prior generation consoles, and offers a variety of in-game digital currency, digital downloadable content, and full-game downloads. The firm’s stores and e-commerce sites operate primarily under GameStop, EB Games, and Micromania.
GameStop (NYSE: GME) Price Action On Daily Charts
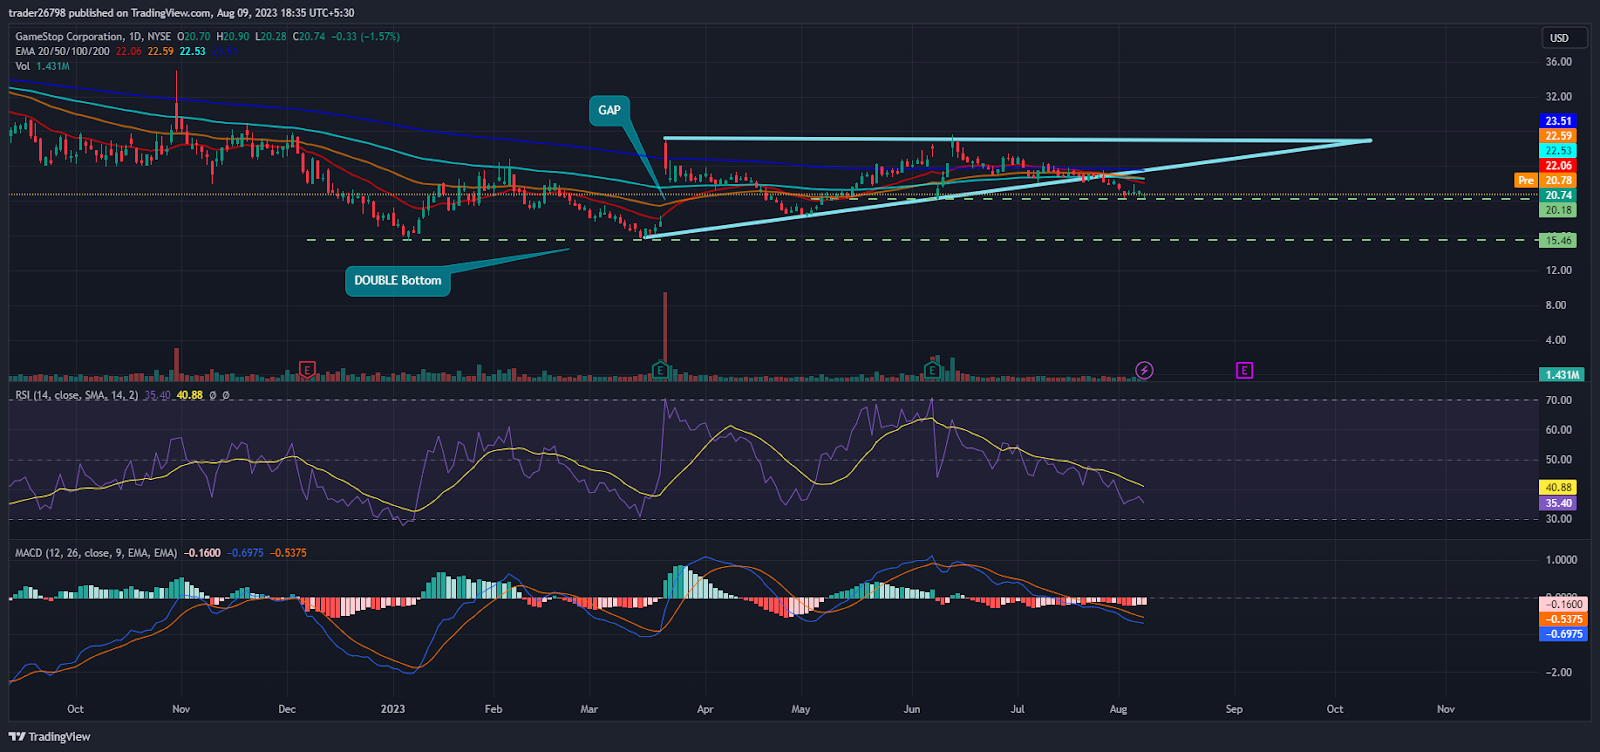
GME stock price shows a weak chart structure. It is struggling to acquire the gains near the support region of $20. However, the stock has filled the gap and is likely to bounce to retain the swing of $25.
As per the Fib retracement levels, GME stock slipped from 38.2% and is trading near the 23.6% showing a negative outlook on the daily charts.
Moreover, the price is near the lower bollinger band, showing seller dominance on the charts.
The RSI curve slipped from the overbought zone and is near the oversold region forming a negative divergence on the charts and signalling selling pressure for the past sessions.
The MACD indicator shows red bars indicating steady profit booking and a short buildup activity.
Conclusion:
GameStop (GME stock) price is trading near the demand zone of $20, suggesting a rebound if held in the region decisively. However, sellers persist in forcing the bulls and making short positions to lead further correction toward $15. However, the price slipped below neutrality and is trading in the selling region, which might challenge the buyers to rescue the gains.
Technical Levels:
Support Levels: $15 and $13
Resistance Levels: $25 and $30
Disclaimer
The views and opinions stated by the author, or any people named in this article, are for informational purposes only and do not establish financial, investment, or other advice. Investing in or trading crypto assets comes with a risk of financial loss.

Andrew is a blockchain developer who developed his interest in cryptocurrencies while pursuing his post-graduation major in blockchain development. He is a keen observer of details and shares his passion for writing, along with coding. His backend knowledge about blockchain helps him give a unique perspective to his writing skills, and a reliable craft at explaining the concepts such as blockchain programming, languages and token minting. He also frequently shares technical details and performance indicators of ICOs and IDOs.


