
 Home
Home News
News
- 1 Rivian Automotive stock price trades at $24.80 while witnessing a gain of 2.14% during the intraday session.
- 2 Rivian stock price trades have climbed above all the major exponential moving averages (EMAs).
- 3 The year-to-date return of Rivian stock is 31.22% while S&P 500 has a YTD of 17.19%.
RIVN stock has been in a strong bullish momentum since the end of June, rising from the low of $13.40 and forming a high at $28.06. The stock price surged roughly 109% since the end of June.
However the price could not sustain the bullish momentum and the move was halted at $28. The price then entered into a corrective phase and formed a support at $23.70 level.
The candle of 8 August, 2023 closed as a strong bullish candle with a gain of 2.14%. If the bullish momentum continues, the stock price might retest the resistance level of $28.
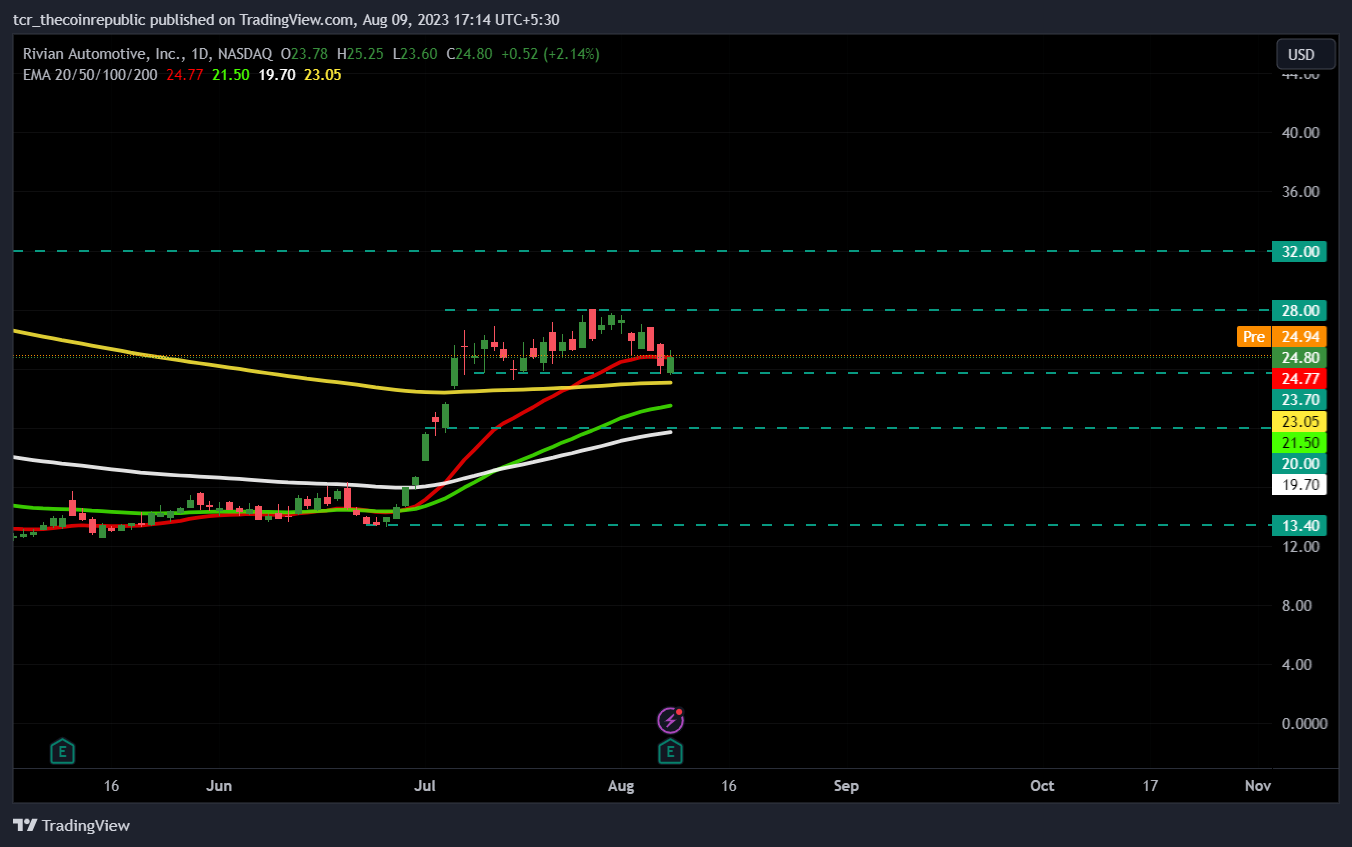
On the other hand, if bears take control and push price below the $23.70 support level, RIVN stock price might melt $20 causing a downfall of roughly 15.50%. If a break of $28 resistance happens, the next target for price is $32.
Quarterly Report Analysis of Rivian Automotive
On 8 August, Rivian Automotive released its Quarter 2 earning report. The EV maker crushed the consensus estimates, beating the revenue estimates of Wall Street. The Wall Street estimated the revenue to be $1 Billion but the company reported the revenue of $1.12 Billion.
The EV maker has also lifted the fiscal year production from the previous 50000 units to 52000 units as the supply chain issue has been clearing up. A loss of $31,595 per vehicle had been reported in Quarter 2, which was $67,329 in the previous quarter.
Quarter 2 ended with $10.2 Billion in short term investments, cash equivalents and cash. The revenue soared to $1.1 Billion from $365 Million in the earlier year quarter. This was primarily due to the delivery of approximately 12,640 cars.
Will RIVN Stock Price Rise Above the $30 Level ?

The stock price has positively crossed the 20, 50, 100 and 200-day exponential moving averages, indicating bullish momentum. Chaikin money flow score dropped below 0 mark as price gained bearish momentum. But currently, it is hovering near the 0 mark, suggesting neither strength nor weakness in the market.
The relative strength index has also started to rise after touching the 52 mark, indicating increase in participation of bulls. The bollinger bands have contracted significantly, indicating decrease in volatility. The price has also touched the lower band and might head toward upper if bullish momentum prevails.
Conclusion
The market structure and price action of Rivian Automotive is slowly turning bullish after the release of its Quarter 2 earnings report. Technical parameters suggest there is a rise in involvement of buyers in the market. The company has also increased the fiscal year production by 2000 vehicles, which is a positive sign for the investors.
Technical levels
Major support: $20 and $13.40
Major resistance: $28 and $32
Disclaimer
The views and opinions stated by the author, or any people named in this article, are for informational purposes only. They do not establish financial, investment, or other advice. Investing in or trading crypto assets comes with a risk of financial loss.
Mr. Pratik chadhokar is an Indian Forex, Cryptocurrencies and Financial Market Advisor and analyst with a background in IT and Financial market Strategist. He specialises in market strategies and technical analysis and has spent over a year as a financial markets contributor and observer. He possesses strong technical analytical skills and is well known for his entertaining and informative analysis of the Financial markets.


