
 Home
Home News
News
- 1 JPM stock shows a rounding bottom formation on the charts.
- 2 Buyers are willing to stretch the gains toward the primary target of $170.
JP Morgan Chase & Company (JPM stock) is showing a positive outlook and holding the gains decisively above the round level of $150. Moreover, the price action shows the rounding bottom pattern suggesting that the $170 level could be reached in the following sessions.
Furthermore, the price action shows buyers are gaining traction and acquiring momentum. In the last sessions, JPM stock has retested the 20-day EMA due to broad selling in the market, which led to mild profit booking. However, the stock has entered bullish territory and suggests a rise soon.
Recently, JPM stock broke out of the consolidation phase, surpassing the neckline of $140. Afterward, the stock led a one-way rally, acquiring gains from the last sessions. However, the trajectory suggests that buyers will gain further strength if the price continues to sustain above $150, and the rally will exceed $170 for the upcoming sessions.
JPMorgan Chase & Co. is a financial holding company that provides financial and investment banking services. The firm offers a range of investment banking products and services in all capital markets, including advising on corporate strategy and structure, capital raising in equity and debt markets, risk management, market making in cash securities and derivative instruments, and brokerage and research.
It operates through the following business segments: Corporate and Investment Bank (CIB), Consumer and Community Banking (CCB), Commercial Banking (CB), and Asset and Wealth Management (AWM). The company was founded in 1968 and is headquartered in New York, NY.
At press time, JPM stock is trading at $155.88 with an intraday drop of 0.56% showing neutrality in the overnight session. Moreover, the trading volume increased by 0.98% to 8.670 Million, and the market cap is $453.001 Billion. However, analysts maintained a buy and overweight rating with a yearly target price of $169.75.
JPM Stock Price Peeks Bullishness On Daily Charts
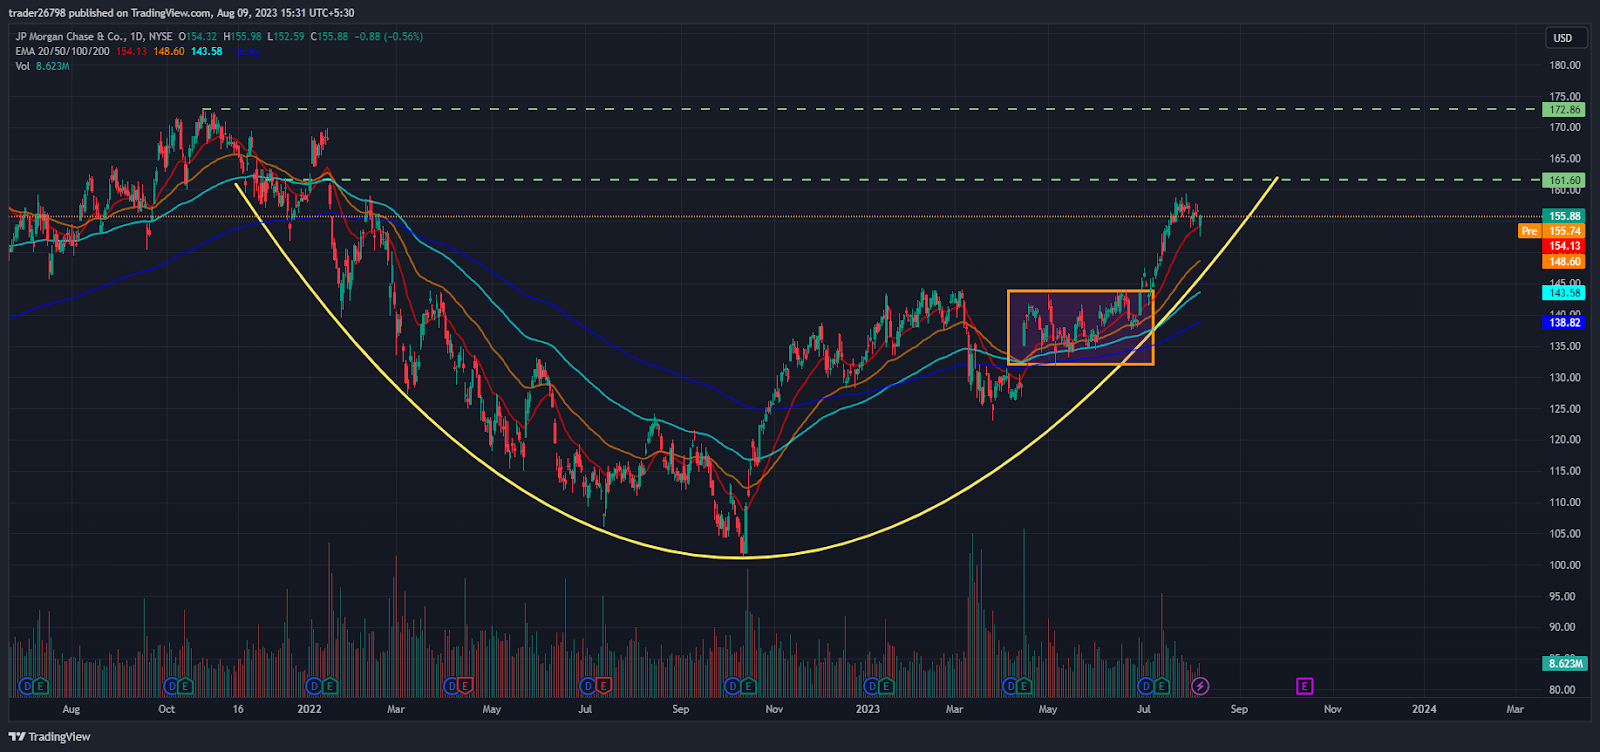
On the daily charts, JPM stock price recovered from the lows of $100 in the past months and showed a trend reversal. Afterward, the stock gained fresh buying momentum, and a vertical move was noted on the charts. JPM stock is trading near the upper bollinger band and above the 61.8% Fib level, heading toward the 783% zone near $165.
Short Term Charts Shows Buyer Dominance
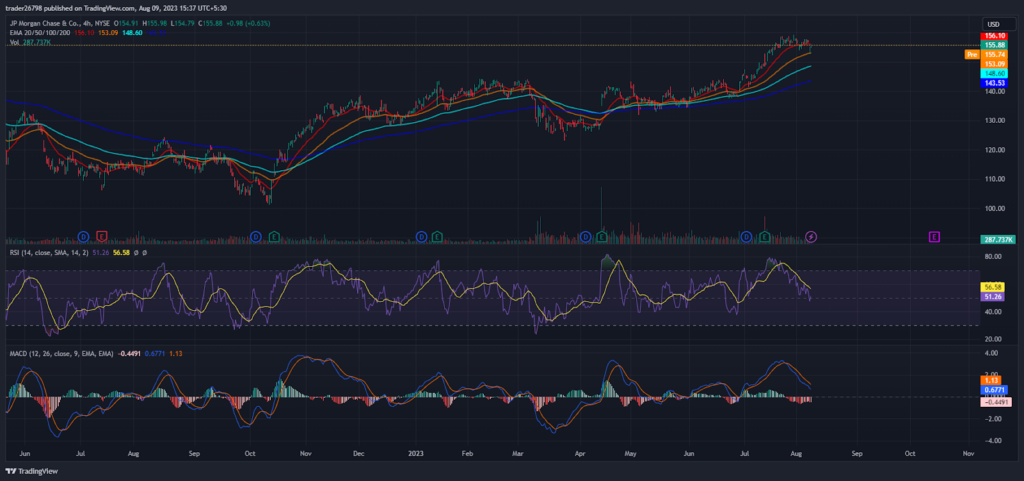
On the 4-hour charts, JPM stock persists in gaining and showing higher highs sequence surpassing the ongoing clusters decisively. However, the price is trading in the bull trajectory, where buyers continued making long positions and short covering moves, suggesting a rise in the following sessions.
The RSI fell from the overbought zone and stayed near neutrality in yesterday’s sessions. However, positive divergence was noted on the charts indicating a growth outlook.
The MACD indicator showed a bearish crossover forming red bars on the histogram, indicating profit booking in the past sessions. However, the technical indicators still favor the rise in the near term.
Conclusion:
JP Morgan Chase & Company (JPM stock) showed a bull move and revamped from the support zone favoring the bulls on the charts. Moreover, the technicals suggest that the rally will extend further toward the swings of $170.
Technical Levels:
Support Levels: $150 and $143
Resistance Levels: $165 and $170
Disclaimer
The views and opinions stated by the author, or any people named in this article, are for informational purposes only and do not establish financial, investment, or other advice. Investing in or trading crypto assets comes with a risk of financial loss.
Mr. Pratik chadhokar is an Indian Forex, Cryptocurrencies and Financial Market Advisor and analyst with a background in IT and Financial market Strategist. He specialises in market strategies and technical analysis and has spent over a year as a financial markets contributor and observer. He possesses strong technical analytical skills and is well known for his entertaining and informative analysis of the Financial markets.


