
 Home
Home News
News

- 1 AXP stock showed distribution from the highs of $175 faced rejection.
- 2 Bears have attained a firm grip and did not permit buyers to escape.
American Express Company (AXP stock) price faced selling pressure post Q2 earnings release. The supply region slipped to the 200-day EMA. Buyers tried to rebound unsuccessfully, and the double top pattern formed on the charts. A drop to $160 in likely in the following sessions.
However, AXP stock price is close to the 50% fib level, and the technicals suggest a lower high is pending, which can be seen as a temporary bounce toward the 20-day EMA near $168.

AXP stock price action shows a negative outlook. The lower highs and lower lows sequences were noted on the charts. Moreover, the double top pattern and the rejection near the supply range highlights the sellers’ strong grip. However, buyers need to hold the 200-day EMA to sustain the trajectory. If the price slips below $160, it will lead to fresh selling in the stock.
However, AXP stock traded above neutrality but failed to sustain near the highs and faced multiple rejections. Moreover, the price respected the lower trendline, revamped from it several times, and was in an uptrend for the past sessions.
The chart suggests that if AXP stock manages to hold the selling pressure near the 200-day EMA, it will bring a fresh reversal from it to retain the highs of $170, followed by $180.
At press time, AXP stock price is trading at $163.82 with an intraday drop of 1.24%, showing a correction in yesterday’s session. Moreover, the trading volume increased by 0.24% to 2.565 Million, and the market cap is $120.674 Billion. However, analysts maintained a buy and outperform rating with a target price of $182.09.
AXP Stock Price Hovering Near 200 Day EMA On Daily Charts
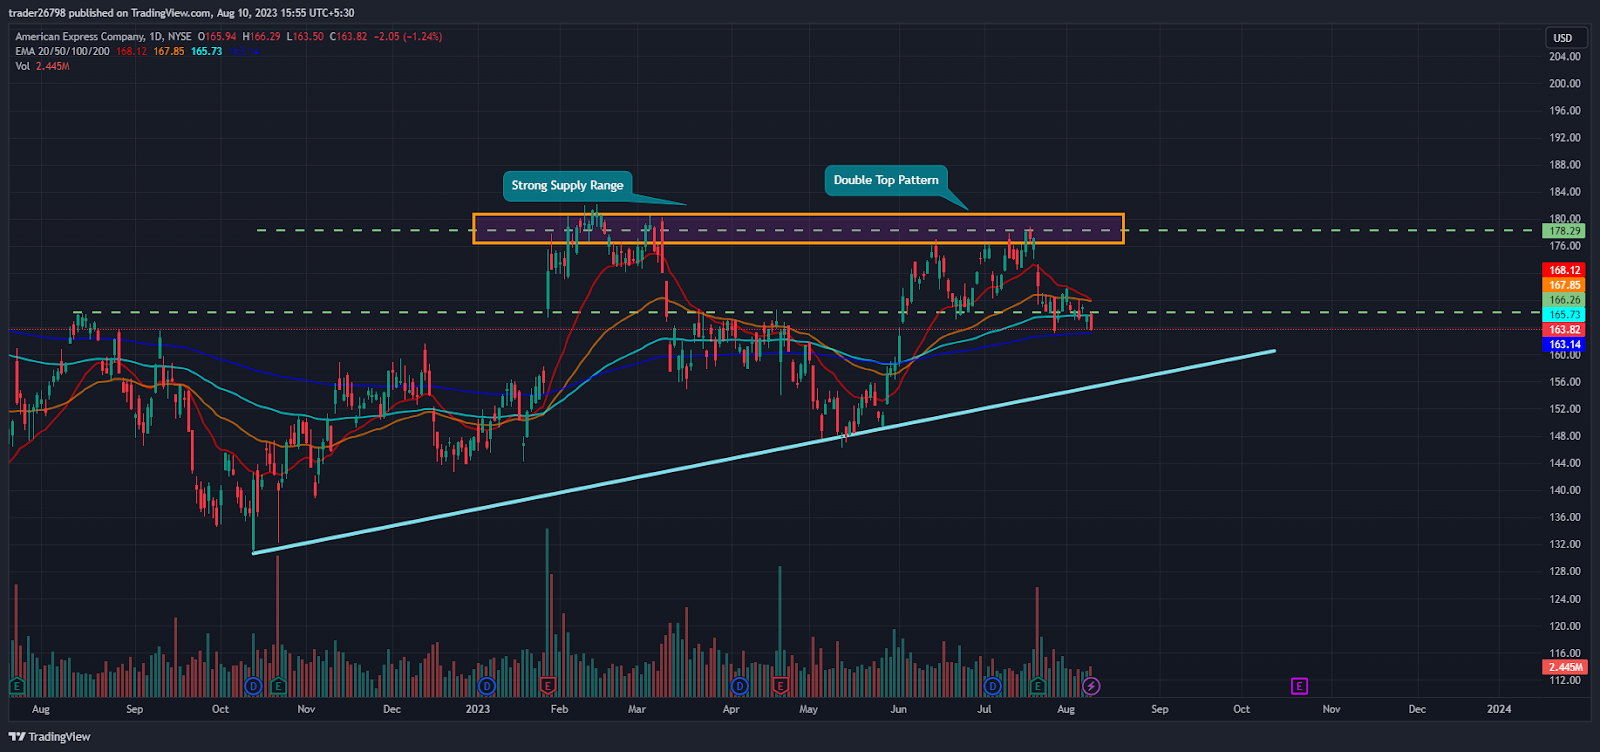
On the daily charts, American Express stock price is struggling near the 200-day EMA and looking for a rebound. However, the selling pressure arises due to the fresh short additions. Moreover, the long positions started unwinding, resulting in slippages in the last session.
Short Term Charts Revealing Seller Dominance
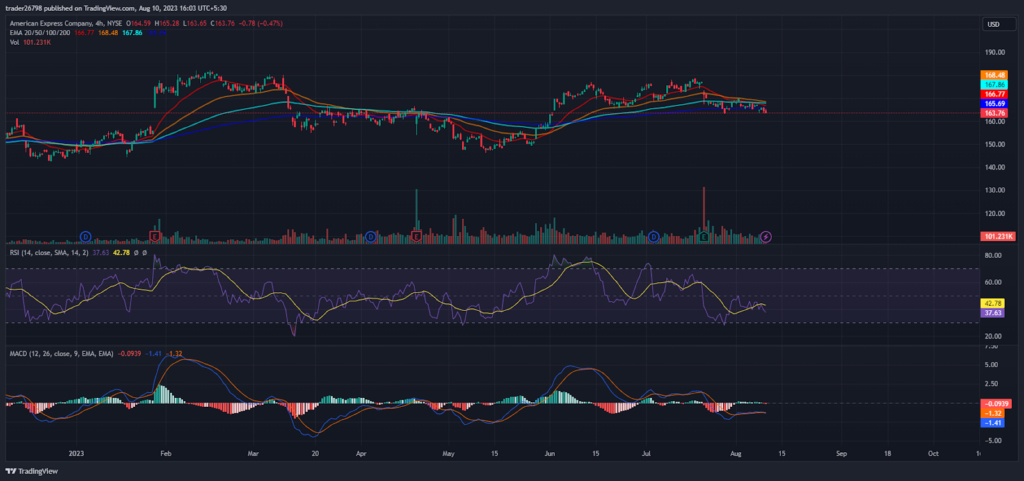
On the 4-hour charts, AXP stock price fell below the 200-day EMA and showed intense selling pressure from the top.
The RSI curve slipped toward the oversold region, and negative divergence was noted on the charts. However, it suggests a bounce that will retest the 20-day EMA near $168.
The MACD indicator shows the convergence of the moving average and suggests a crossover in the following sessions. Buyers are attempting to regain their strength and looking for a bounce.
Conclusion:
American Express Company (AXP stock) price shows selling pressure from the supply zone of $168. Fresh short buildup can be seen, leading to price rejection and slippages toward the 200-day EMA. Key indicators indicate that a rebound is likely as the data shows the oversold signal in the past sessions.
Technical Levels:
Support Levels: $160 and $155
Resistance Levels: $168 and $175
Disclaimer
The views and opinions stated by the author, or any people named in this article, are for informational purposes only and do not establish financial, investment, or other advice. Investing in or trading crypto assets comes with a risk of financial loss.

Adarsh Singh is a true connoisseur of Defi and Blockchain technologies, who left his job at a “Big 4” multinational finance firm to pursue crypto and NFT trading full-time. He has a strong background in finance, with MBA from a prestigious B-school. He delves deep into these innovative fields, unraveling their intricacies. Uncovering hidden gems, be it coins, tokens or NFTs, is his expertise. NFTs drive deep interest for him, and his creative analysis of NFTs opens up engaging narratives. He strives to bring decentralized digital assets accessible to the masses.


