
 Home
Home News
News

- 1 Ethereum is currently trading at $1850.0 with a dip of 0.23% in the past 24 hours.
- 2 Ethereum is a giant in the crypto industry, with a market capitalization of $222.282 Billion.
Ethereum is currently trading at $1849.82 with a market cap of $222.25 Billion. However, Ethereum’s on-chain monthly volume in Aug 2023 is $15.69k which is less compared to previous months.

Take a Deep Dive in ETH On-chain Data
Based on the on-chain data on Glass Node, Ethereum had 379,497 active addresses at the price of $1862.08 per ETH on 30 July. However, on Aug 09, 2015, ETH held only 731 active addresses at the price of $0.71983011, reflecting the growth of crypto in the past eight years. In July 2022, ETH had an on-chain volume of $84.71 Billion, which is a drop of around $53.74 Billion in July 2023.

The transaction count of Ethereum on July 30 is 956,724 at the price of $1862.08. However, on Aug 09, 2015, ETH had only 1,312 transactions at the price of $0.71983011 which shows the remarkable incline in crypto transaction activity over the years. Also, it had a monthly transaction count of 37.17 Million in July 2022, which decreased to about 29.66 Million in one year of time.
Ethereum Price Technical Analysis
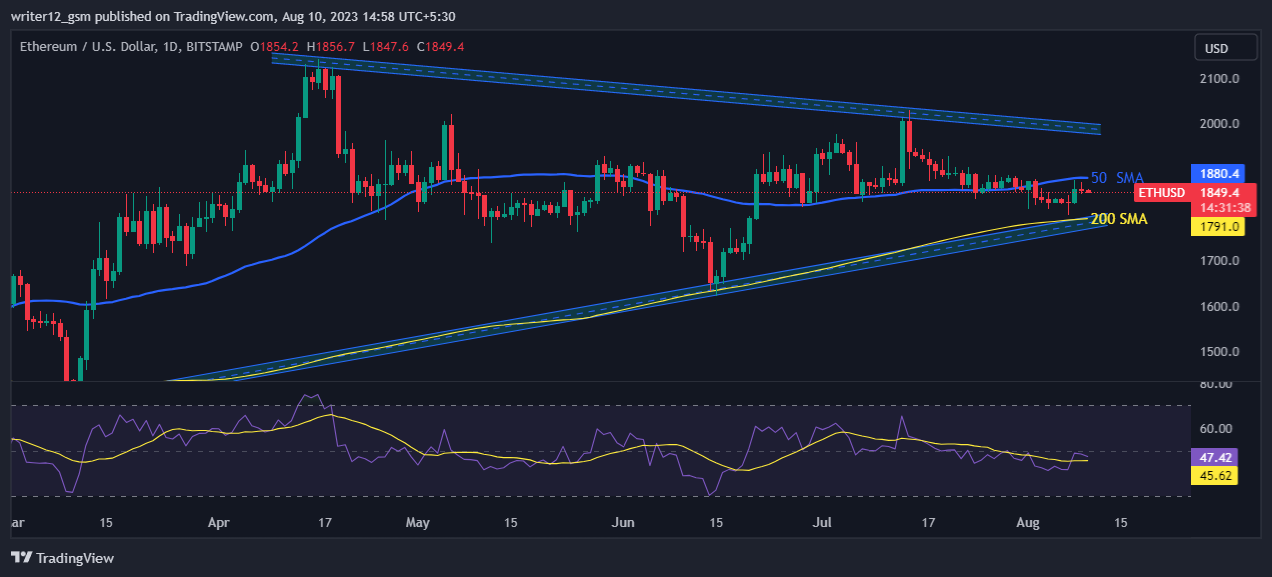
Ethereum’s price is trading between the 50-day and 200-day SMAs, indicating a neutral trend. However, the outlook for next week is optimistic, as long as the buyers keep pushing the price higher.
The Supertrend indicator gives a green signal, confirming the bullish bias. This suggests that crypto is likely to continue its upward trend, creating potential opportunities for traders and investors.
The RSI line is at 47.35, which shows that ETH is neither overbought nor oversold at the moment. Also, the 14-day SMA line is at 45.61.
Right now, MACD is declining and approaching the zero line. The MACD line at -10.0 and the signal line at -10.0 are both below the zero line which means that the MACD is in the neutral zone.
Technical Levels :
- Support Level – $1715.00
- Resistance Level – $2030.00.
Conclusion
Ethereum has shown growth in the number of active addresses, transaction count, and on-chain volume over the years. This shows the increment in the adoption and popularity of crypto. ETH price is currently in a neutral trend. The MACD and RSI are in neutral zones, indicating that the crypto is not overextended and has room for further upside. The outlook for the next week is optimistic, as long as the buyers keep the momentum going. Traders and investors can look for potential opportunities to profit from the upward trend of Ethereum.
Disclaimer
The analysis given in this article is for informational and educational use only. Do not take this information as financial or trading advice. Trading and investing contain financial risk. Before making any investment or trading decision, please consider your risk profile and circumstances.
Mr. Pratik chadhokar is an Indian Forex, Cryptocurrencies and Financial Market Advisor and analyst with a background in IT and Financial market Strategist. He specialises in market strategies and technical analysis and has spent over a year as a financial markets contributor and observer. He possesses strong technical analytical skills and is well known for his entertaining and informative analysis of the Financial markets.


