
 Home
Home News
News

- 1 Morgan Stanley’s stock price decreased by 2.19% over the past seven days.
- 2 MS Wholesale Corporation (NYSE: MS) stock’s 52-week price range is $74.67-100.99.
- 3 Morgan Stanley’s stock price is currently trading at $87.56 with a drop of 1.03% in the last 24 hours with a market cap of $145.262 Billion.
Morgan Stanley was established in 1935 by Henry Sturgis Morgan and Harold Stanley, who used to work for J.P. Morgan & Co., another famous financial institution. It has grown over the years through mergers and acquisitions and has expanded its presence in more than 40 countries.

Its stock price was $87.56 per share as of August 10, 2021, which was a slight decrease from the previous day’s closing price of $88.47. Morgan Stanley’s stock price has varied between $74.67 and $100.99 in the past year, indicating that it has experienced some volatility in the market.

The stock pays out 3.88% of its earnings as dividends to its shareholders.
Technical Analysis of Morgan Stanley Stock Price in 1-D Timeframe
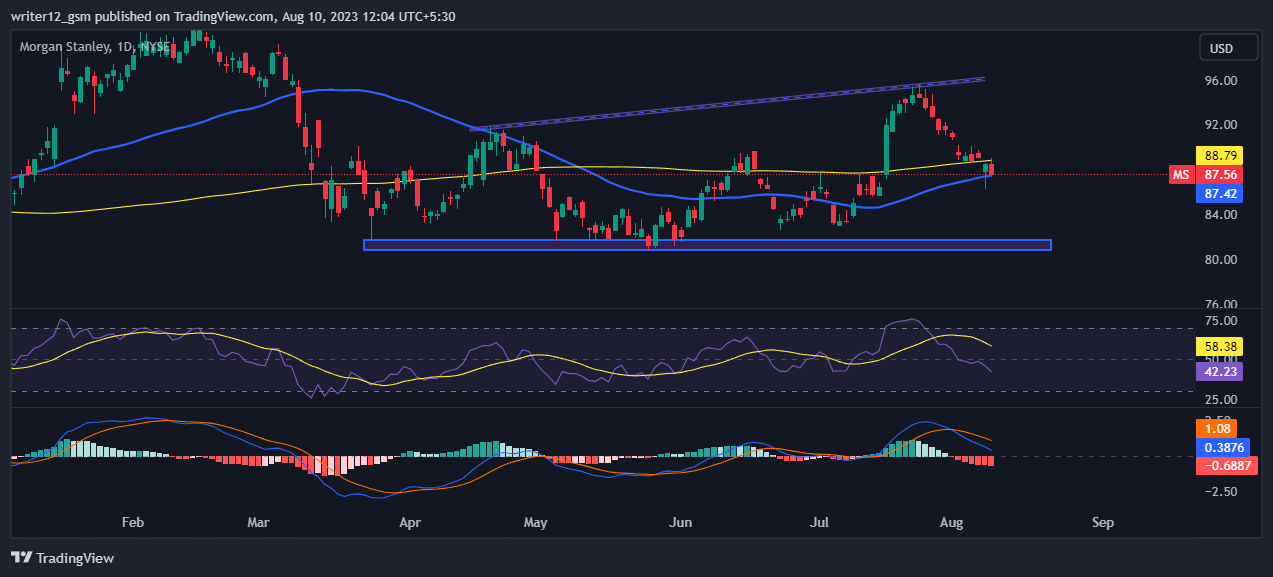
Currently, Morgan Stanley stock (NYSE: MS) is trading between the 50 and 200-day simple moving averages, which are supporting the price trend. If the price breaks the 50 SMA then it will go down in the upcoming days.
However, if selling volume adds up, then the price might conquer supporting SMAs by making lower highs and lows. Hence, MS price is expected to move downwards giving bearish views over the daily time frame chart.
The current value of RSI is 42.23 points. The 14 SMA is above the median line at 58.38 points which indicates that the Morgan Stanley stock is bearish.
The MACD line at 0.3876 and the signal line at 1.08 are above the zero line. A bearish crossover is observed in the MACD indicator which signals more bearishness for the MS stock price.
Summary
Morgan Stanley (NYSE: MS) has sounds financials. Technical oscillators also support the bearish trend. The MACD, RSI, and EMA are suggesting negative signs and indicating that the downtrend may continue in the MS stock price. Morgan Stanley’s price action suggests that the investors and traders are bearish on the 1-D time frame. The price action reflects a bearish view at the current moment. Investors and traders should wait for proper setup for the next move and avoid FOMO.
Technical Levels
- Support Levels: Nearest support $81.97.
- Resistance levels: Nearest resistance level $85.52.
Disclaimer
The analysis provided in this article is for informational and educational purposes only. Do not rely on this information as financial, investment, or trading advice. Investing and trading in stock involves risk. Please assess your situation and risk tolerance before making any investment decisions.

Andrew is a blockchain developer who developed his interest in cryptocurrencies while pursuing his post-graduation major in blockchain development. He is a keen observer of details and shares his passion for writing, along with coding. His backend knowledge about blockchain helps him give a unique perspective to his writing skills, and a reliable craft at explaining the concepts such as blockchain programming, languages and token minting. He also frequently shares technical details and performance indicators of ICOs and IDOs.


