
 Home
Home News
News
- 1 Wells Fargo stock is trading at $43.72 with a drop of 1.71% in the past 24 hours.
- 2 WFC’s 52-week price range is $32.25 to $48.84.
WFC was rejected from its upper trendline and took support on the 50 SMA line. A bullish cross signals bullishness in the coming trading sessions. However, by analysing the price action data of the Wells Fargo stock, it can be said that it is in an uptrend. Wells Fargo is performing well right now. From its 52-week bottom price of 35.25$, it increased to a $44.25 peak price.

To date, WFC stocks have generated 5.07% returns. Over the last 6 months, there was a 7.77% decline in returns. The stocks offered a return of 2.36% and -3.06% in the past seven days.

The current market sentiments are mildly positive about the stock. The average 3 months volume in Wells Fargo is $17.77 Million. Buyers are showing interest in the stock in the present market scenario.
WFC Stock Price Technical Analysis
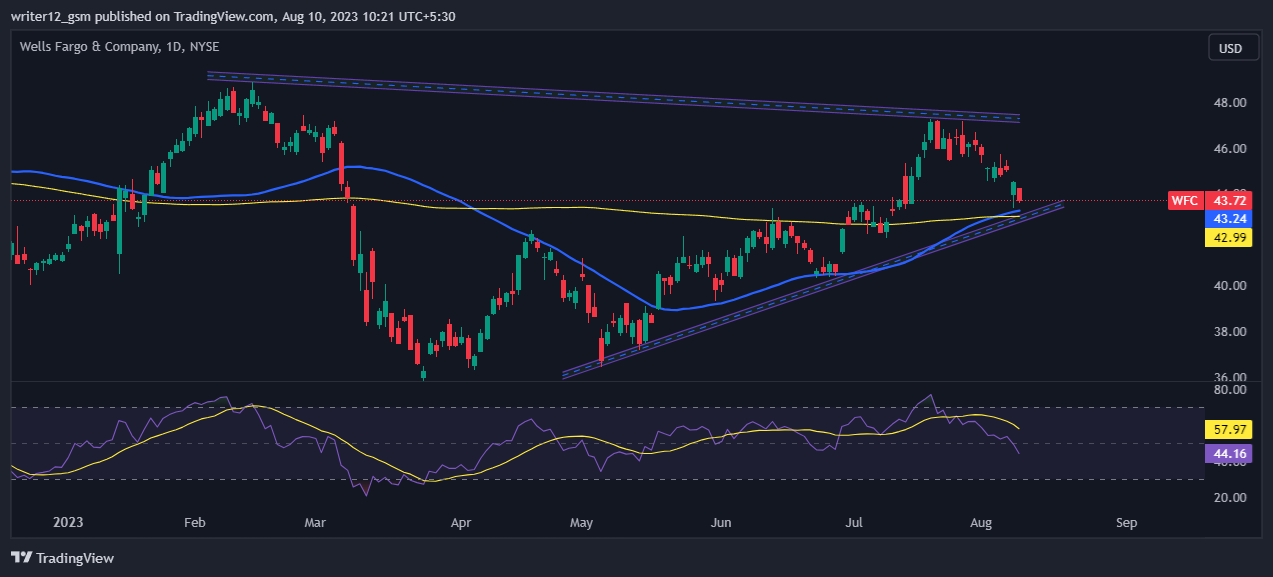
Wells Fargo ( NYSE: WFC) stock has risen steadily over the past three months, gaining 15.78% and 2.36% last month. Currently, WFC stock is trading at $43.72 and has been trying to hold on to this level after a pullback.
If it can keep this level, the Wells Fargo price could continue to go up and reach the first and second targets of $47.39 and $49.00. However, if the WFC price cannot maintain this level and falls, then it might hit the closest support levels of $40.00 and $36.00.
Currently, Wells Fargo stock (NYSE: WFC) is trading above the 50 and 200-day SMAs simple moving averages, which are supporting the price momentum.
However, if buying volume adds up, then the price might support bullish momentum by making higher highs and make new highs. Hence, the Wells Fargo price is expected to move upwards, giving bullish views over the daily time frame chart.
The current value of RSI is 44.16 points. The 14 SMA is above the median line at 57.97 points which indicates that the Wells Fargo stock is bullish.
The MACD line at 0.3985 and the signal line at 0.7584 are above the zero line. A bearish crossover is observed in the MACD indicator which signals weakness in the momentum of the WFC stock price.
Summary
Wells Fargo (NYSE: WFC) technical oscillators also support the bullish trend. The MACD, RSI, and EMA are emphasizing positive signs and imply that the uptrend may continue in the WFC stock price. Price action suggests that the investors and traders are bullish on the 1-Day time frame. The price action reflects a bullish perspective at the moment.
Technical Levels
- Support Levels: $40.00 and $36.00.
- Resistance levels: $47.39 and $49.00.
Disclaimer
The analysis provided in this article is for informational and educational purposes only. Do not rely on this information as financial, investment, or trading advice. Investing and trading in stock involves risk. Please assess your situation and risk tolerance before making any investment decisions.

Adarsh Singh is a true connoisseur of Defi and Blockchain technologies, who left his job at a “Big 4” multinational finance firm to pursue crypto and NFT trading full-time. He has a strong background in finance, with MBA from a prestigious B-school. He delves deep into these innovative fields, unraveling their intricacies. Uncovering hidden gems, be it coins, tokens or NFTs, is his expertise. NFTs drive deep interest for him, and his creative analysis of NFTs opens up engaging narratives. He strives to bring decentralized digital assets accessible to the masses.


