
 Home
Home News
News
- 1 GD stock price decreased by 0.37% over the past week and the current price is trading above major EMA’s.
- 2 General Dynamics Corporation ( NYSE: GD) stock’s 52-week price range is $202 – $256.
General Dynamics experienced an incline in its earnings at a rate of 0.8% per year on average, according to Simply Wall St., a financial website. The Aerospace and defense industry’s average annual earnings growth is 5.9%. Therefore, General Dynamics’s earnings are lower than the industry average.
General Dynamics has a debt-to-equity ratio of 50.1%, as reported by Simply Wall St. This implies that it has less debt than equity, which is the difference between its total assets of $52.56 Billion and total liabilities of $33.08 Billion. General Dynamics’s debt is $9.76 Billion, while its equity is $19.48 Billion.
Moreover, General Dynamics Corporation (GD) stock market capitalization is $61.615 Billion and the total revenue is $39.407 Billion. Moreover, the stock’s basic EPS is $12.30 and the price-to-earnings ratio is 18.56.
Technical Analysis of GD Stock Stock Price in 1-D Timeframe
The price action shows that General Dynamics Corporation ( NYSE: GD) stock price has been on an inclining trend for the last three months, increasing by 8.05% making higher highs and higher lows, and rising upwards also recent Q3 earning report showed the stock reported revenue is higher than expected revenue by around 7%.
At the time of writing, GD stock took support at the $220 level and rose, and the price traded at around $225.66.
Therefore, if it maintains the current level, the GD prices could continue to move upward and reach the first and second resistances of $227 and $231.
Alternatively, if the GD price fails to sustain the current level and drops, it might hit the nearest support levels of $220 and $217.
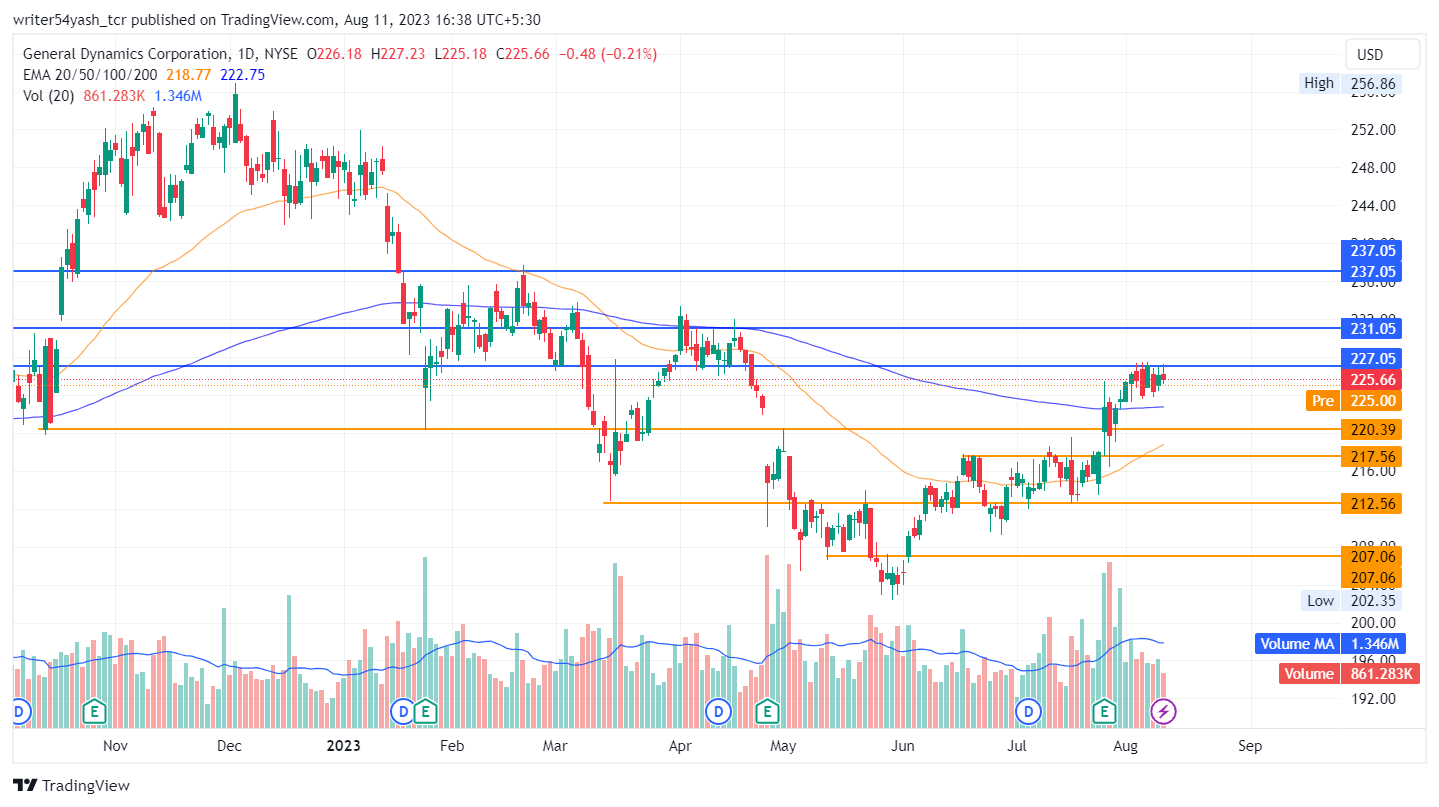
At the time of publishing, General Dynamics Corporation. (NYSE: GD) is trading above the 50, and 200-day EMA (exponential moving averages), which supports the GD price trend.
Hence, the GD price is expected to move upwards showing a bullish overview over the daily time frame chart.
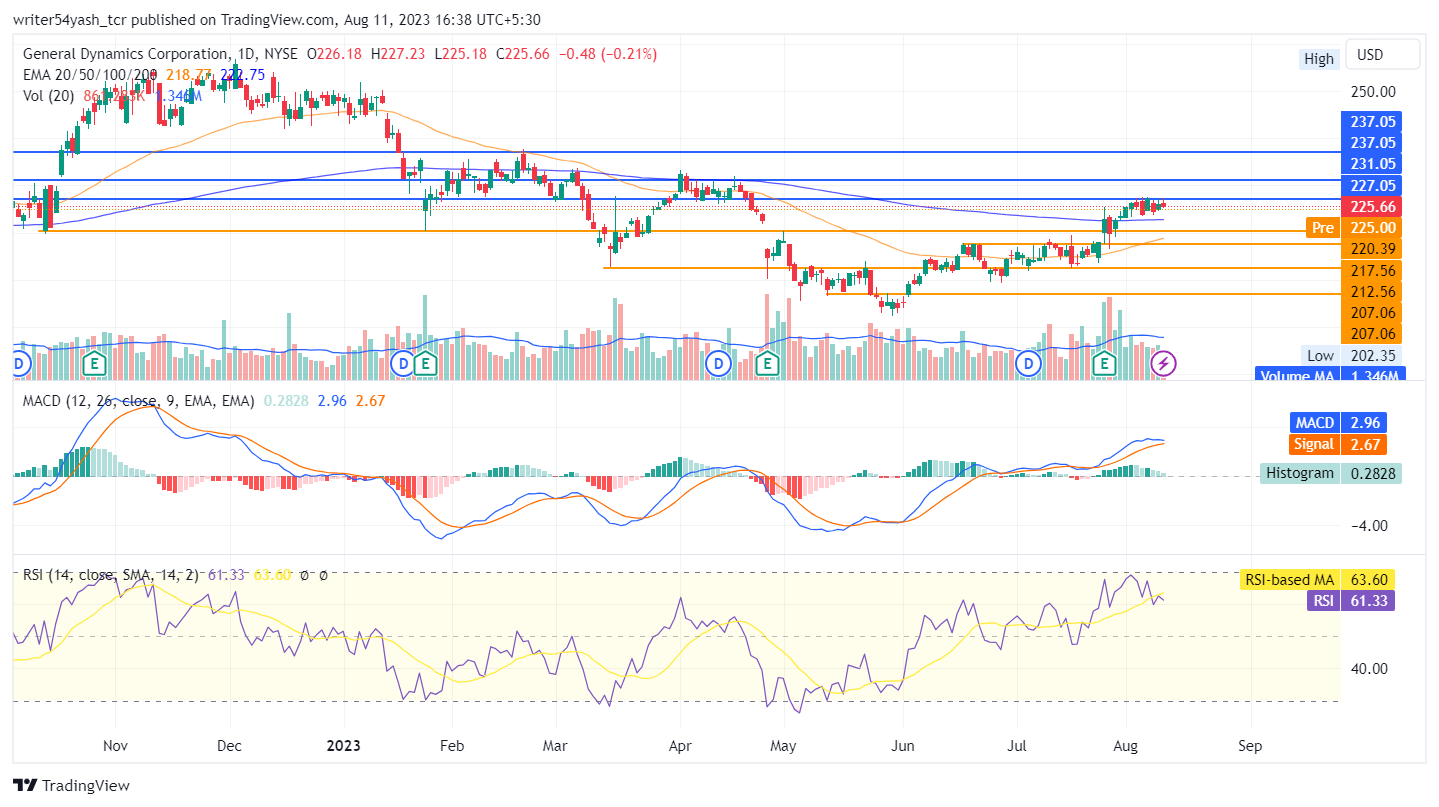
The current value of RSI is 61.33 points. The 14 SMA is above the median line at 63.60 points which indicates that General Dynamics stock is in bullish territory and above 14 SMA, indicating the bullishness for the General Dynamics stock.
The MACD line at 2.96 and signal line at 2.67 are above the zero line and both lines have crossed each other. A bullish crossover is observed in the MACD oscillator which might signal more bullishness for the General Dynamics stock price.
Summary
General Dynamics Corporation. (NYSE: GD) indicates that the investors and traders of the stock price are bullish on the 1-D time frame. The price action reflects a bullish outlook at the time of publishing. The technical analysis tools of the General Dynamics stock price also support the bullish trend. The MACD, RSI, and EMA highlight positive signals and imply that the uptrend may continue in General Dynamics’s stock price.
Technical Levels
- Support levels: The nearest support levels for General Dynamics’s stock price are $220 and $217.
- Resistance levels: The nearest resistance levels for General Dynamics stock price are $227 and $231.
Disclaimer
In this article, the views and opinions stated by the author, or any people named are for informational purposes only, and they don’t establish the investment, financial, or any other advice. Trading or investing in cryptocurrency assets comes with a risk of financial loss.

Adarsh Singh is a true connoisseur of Defi and Blockchain technologies, who left his job at a “Big 4” multinational finance firm to pursue crypto and NFT trading full-time. He has a strong background in finance, with MBA from a prestigious B-school. He delves deep into these innovative fields, unraveling their intricacies. Uncovering hidden gems, be it coins, tokens or NFTs, is his expertise. NFTs drive deep interest for him, and his creative analysis of NFTs opens up engaging narratives. He strives to bring decentralized digital assets accessible to the masses.


