
 Home
Home News
News

- 1 INJ price is consolidating and struggles to escape the zone below $8.00.
- 2 Buyers want to retain the swing highs of $10.00 in the upcoming sessions.
Injective price showed an uptrend for the past sessions and maintained the gains above the 100-day EMA near the cluster of $7.60 in the bullish territory. However, a mild correction was noted, and the price retested the 50-day EMA. Still, instead of selling, investors persisted in accumulating and looked to escape the neckline of the consolidation zone near $8.00.
The chart shows the formation of the rounding bottom pattern suggesting a bounce to revisit the highs of $8.40 followed by $9.00 in the subsequent sessions. Moreover, price action favors the buyers, and long buildup activity was noted on the charts. Furthermore, the ascending triangle pattern is formed on the charts, and the price persisted in creating a roller coaster move in the past sessions.

Injective price is on an upward trajectory to $8.50, which if surpassed, the price will revisit the highs of $10.00. Conversely, the lower trajectory is near $7.20, which, if it breaks, the price will revisit the 200-day EMA near $6.50.
At press time, INJ was trading at $7.73 with an intraday gain of 0.40%, showing neutrality. Moreover, the trading volume increased by 3.61% to $27.96 Million, and the pair of INJ/BTC is at 0.000263 BTC. However, the market cap of INJ is $654.83. The day high of INJ is $7,766, and the day low at $7.636 indicates a narrow trading range.
INJ Price Action On Daily Charts
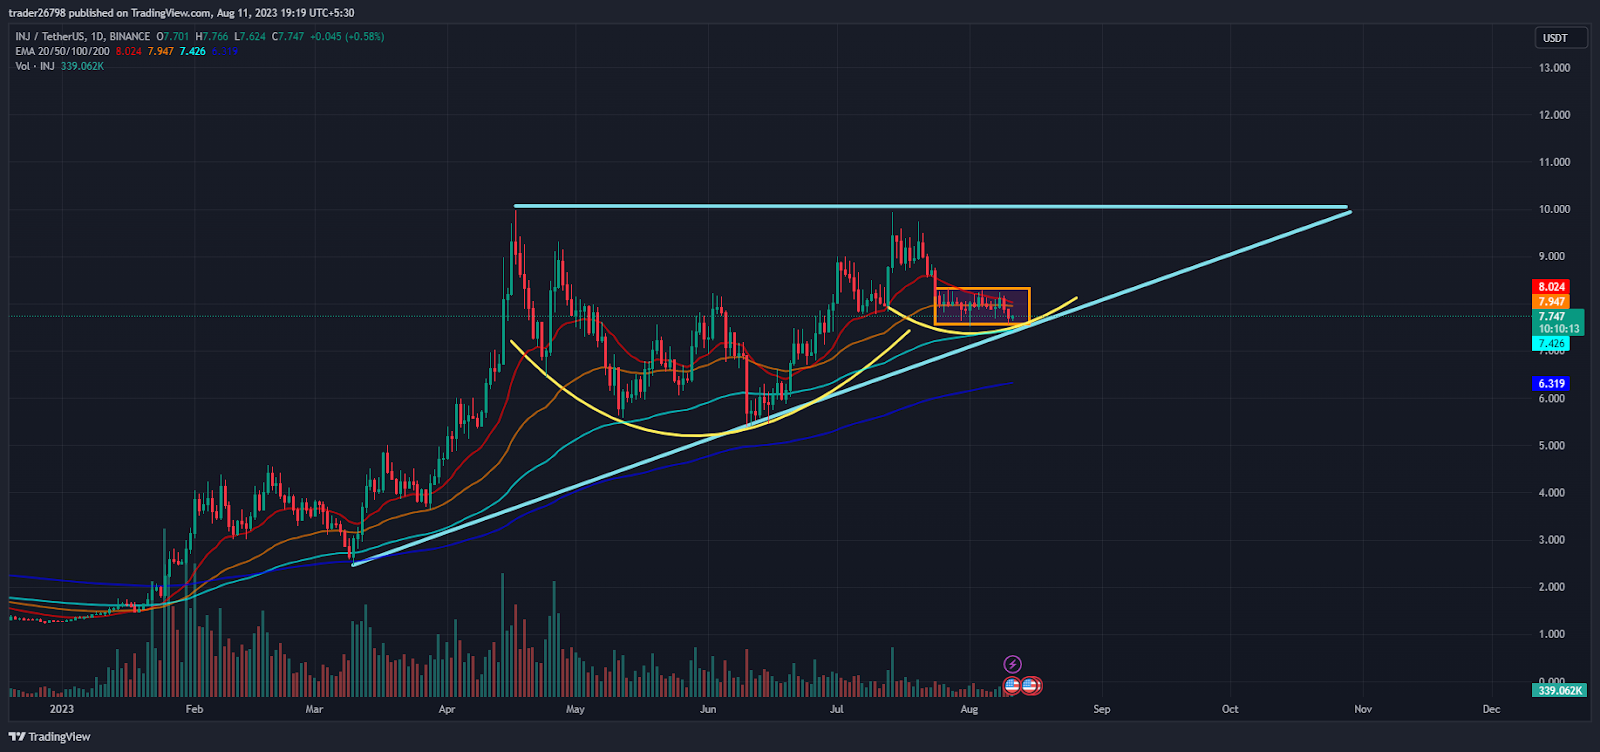
On the daily charts, INJ price formed a rounding bottom pattern, and the price paused near the lower trendline and waited for a bounce near the 50-day EMA. However, the technicals show that bulls have attained strength for the past sessions and are accumulating to escape the region soon.
As per the Fib levels, INJ price is trading above 50% and showing a rejection from 61.8%, which offers a strong resistance zone near $10.
However, the price is above the mid bollinger band, suggesting a near-term bounce toward the cluster of $8.50.
Short Term Charts Showing Price Consolidation
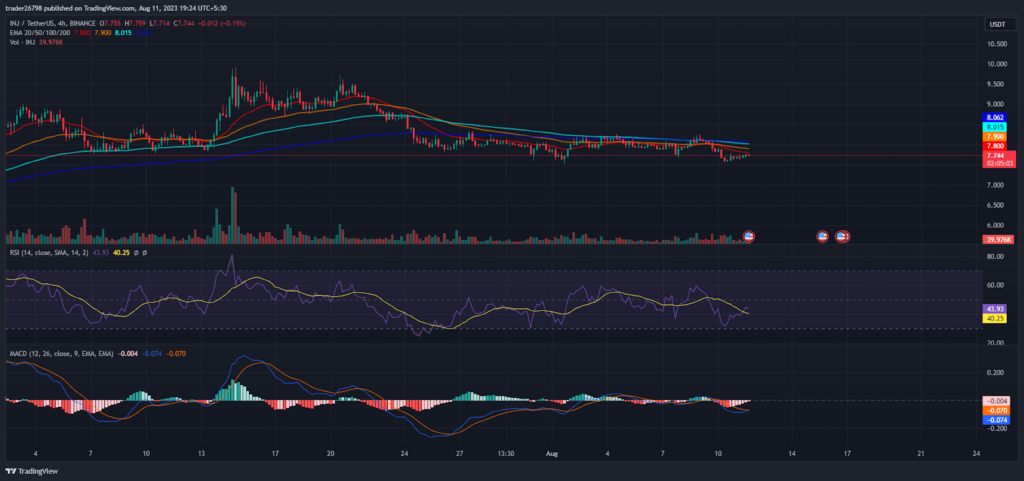
On the 4-hour charts, INJ price is consolidating and staying between the $7.60 – $7.80 range with lower volumes. However, the trend is strong, and buyers are attempting to break the zone and try to sustain above the round spot of $8.00.
The RSI curve is near 45, near neutrality, forming a negative crossover due to the consolidation in price, which impacts a negative outlook on the charts.
The MACD indicator showed a bearish crossover, but the red bars were near the end, and a crossover is imminent. However, the price could consolidate.
Conclusion:
Injective price is trading near the 50-day EMA and facing a consolidation zone, where buyers are trying to regain momentum and are willing to revisit the highs near $9.00. Moreover, the technical parameters still favor the bulls and suggest a bounce in the following sessions.
Technical Levels:
Support Levels: $7.20 and $6.60
Resistance Levels: $8.30 and $9.00
Disclaimer
The views and opinions stated by the author, or any people named in this article, are for informational purposes only and do not establish financial, investment, or other advice. Investing in or trading crypto assets comes with a risk of financial loss.
Mr. Pratik chadhokar is an Indian Forex, Cryptocurrencies and Financial Market Advisor and analyst with a background in IT and Financial market Strategist. He specialises in market strategies and technical analysis and has spent over a year as a financial markets contributor and observer. He possesses strong technical analytical skills and is well known for his entertaining and informative analysis of the Financial markets.


