
 Home
Home News
News
- 1 The Aptos coin’s price increased by 6.42% over the last week but it is trading below major EMAs.
- 2 The price of the APT coin is trading at $7.13 and the 52-week range is $20 – $5.
Aptos crypto surged by 1.14% in market value and plummeted by 48.15% in trading volume in the last 24 hours, as per the CoinMarketCap, a crypto data analysis website. Its market value is $1,574,837,312 and its trading volume is $129,940,659. There are 220,347,781 APT in circulation.
The APT coin has performed well in the last month, increasing by 2.00% and plummeting by 45.61% in the last six months. Aptos (COINBASE: APT) coin has a positive year-to-date return of 106.07% and a negative one-year return of 20.78%.

APT Coin Price Technical Analysis in the 1-Day Timeframe
APT coin price showed a downward trend for the past six months from the major supply zone around $20.09 by 26 January 2023, decreasing by 65% during this period. At the time of publication, the APT Coin price is trading at $7.13, and the price took recent support at $6.51.
Therefore, if the APT Coin price sustains the current level and rises, then it might hit the nearest resistance levels of $7.98 and $9.36.
However, the APT coin price could continue to move downwards and reach the nearest support at $6.51 and $5.39, if it fails to maintain the current level.

At the time of publishing, the APT crypto price (COINBASE: APT) is trading below the 50, 100, and 200-day EMAs (exponential moving averages), which are rejecting the APT Coin price trend.
However, the 20-day EMA supports the trend. If more buying volume adds up, then the price might conquer rejecting EMAs by making higher highs and lows.
Hence, APT crypto price prediction estimates the prices to move upwards, indicating a bullish outlook over the daily time frame chart for its price.
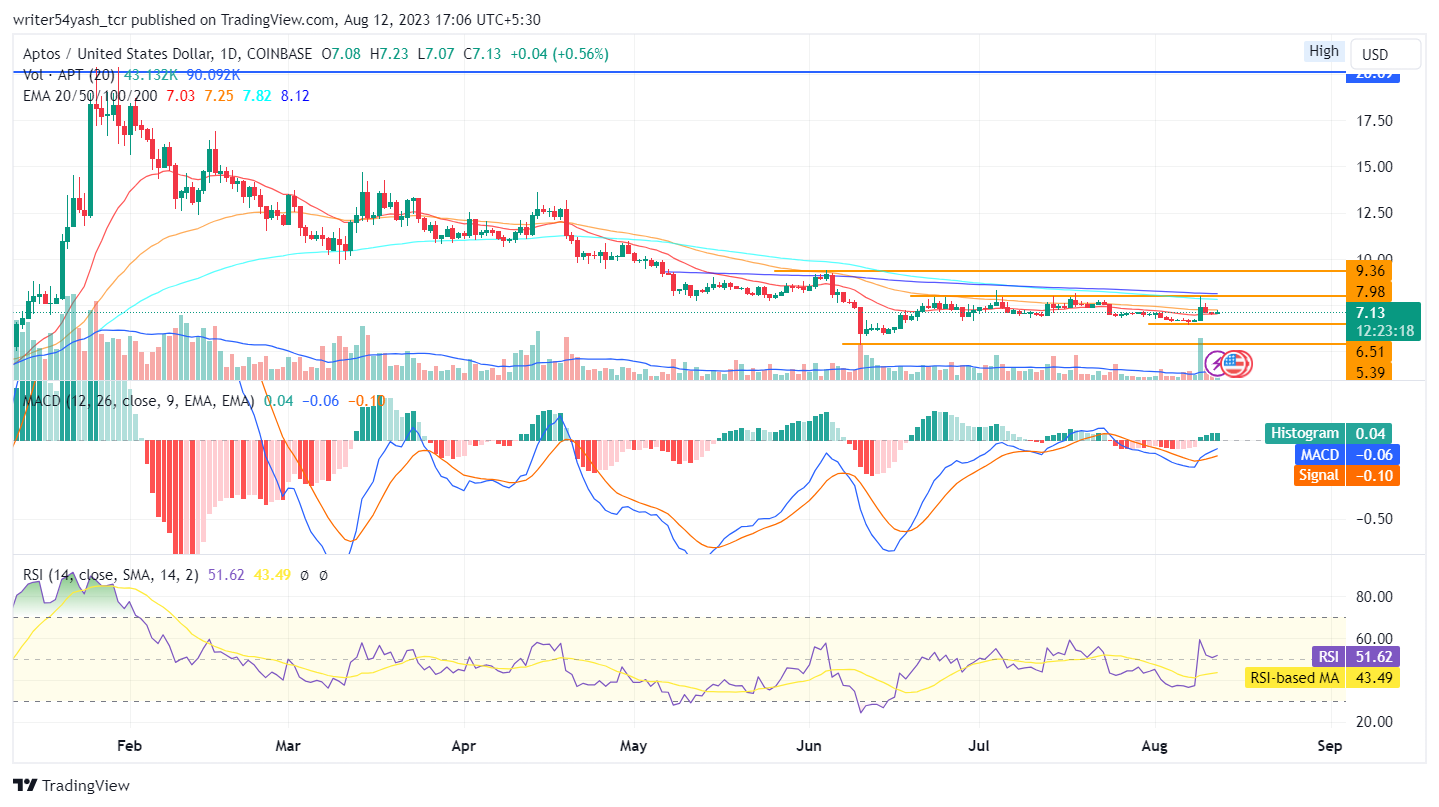
The MACD line at 0.06 and the signal line at 0.10 is above the zero line. Both lines crossed each other and a bullish crossover is observed in the MACD oscillator, suggesting bullish signals. The current value of the RSI is 51.62 points and the 14-day SMA is below the median line at 43.39 points, which indicates bullish sentiments as RSI took support on the 14 SMA line and headed for overbought in the market for the APT crypto.
Conclusion
APT coin price prediction highlights the bullish sentiments and perspectives of investors and traders regarding the APT crypto in the daily time frame. Aptos price action highlights a bullish view at the time of publishing. Moreover, the technical parameters of the Aptos price suggest the continuation of the uptrend over the daily time frame chart. Major trustworthy indicators MACD, RSI, and EMA, provide positive signals regarding the APT coin price.
Technical Levels
- Support levels: The nearest support levels are $6.51 and $5.39.
- Resistance levels: The nearest resistance levels are $7.98 and $9.36.
Disclaimer
In this article, the views and opinions stated by the author, or any people named are for informational purposes only, and they don’t establish the investment, financial, or any other advice. Trading or investing in cryptocurrency assets comes with a risk of financial loss.

Adarsh Singh is a true connoisseur of Defi and Blockchain technologies, who left his job at a “Big 4” multinational finance firm to pursue crypto and NFT trading full-time. He has a strong background in finance, with MBA from a prestigious B-school. He delves deep into these innovative fields, unraveling their intricacies. Uncovering hidden gems, be it coins, tokens or NFTs, is his expertise. NFTs drive deep interest for him, and his creative analysis of NFTs opens up engaging narratives. He strives to bring decentralized digital assets accessible to the masses.


