
 Home
Home News
News
- 1 Synopsys stock is currently trading at $428.46 with a nominal drop of -0.68% and a market cap of 65.194.
- 2 Synopsys stock will report its Q3 2023 earnings on Aug 16, 2023, which will decide the destiny of the stock.
- 3 SNPS took a pause after a good surge and gave a negative return of -4.43% this month.
SNPS stock Q3 2023 earnings are on the way and the share is falling down. SNPS is trading at $428.46 with a trading volume of 477.715K and the average trading volume of the last 10 days being 569.123K. The current market cap of the company is 65.194 Billion with a price-to-earnings ratio of 72.76. The floating share value is 151.236 Million with a basic EPS of 6.04.
The Q2 2023 earnings of the company gave a revenue of 1.40 Billion and a net income of 272.92 Million with a profit margin of 19.49%. However, the profit margin of the stock was less than the Q1 2023 earnings.

This year SNPS’s performance was excellent. Since the beginning of the year, the company gave a return of 32.65% to its investors. However, recently, a weakness in momentum has been observed.
Synopsys Inc. provides semiconductor intellectual property products and offers electronic design automation solutions used to design and test integrated circuits (ICs). SNPS was founded by Aart J, de Geus, Bill Krieger, Rick Rudell, and Dave Gregory in December 1986.
The company works in segments like semiconductor and system design, software integrity, EDA tools, and IP products. SNPS also built solutions for security and compliance testing.
As per TradingView, out of 26 indicators,11 are on the sell side, 10 are on the neutral side, and 5 of them indicate a buy signal. However, the overall weightage of indicators is on the sell side.
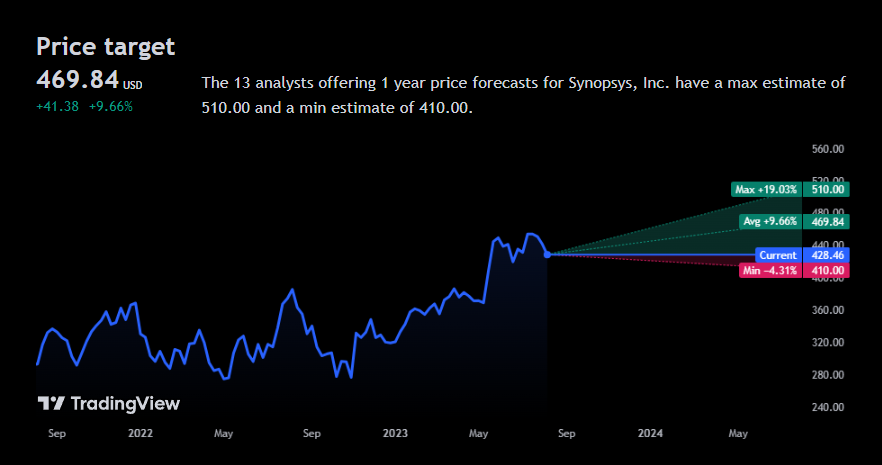
As per TradingView, 13 analysts gave a maximum estimation of a price to be 510.00 and a minimum estimation of a price to be 410.00.
Moreover, out of 14 analysts, 11 are giving a strong buy signal, 2 are giving a buy rating and one is hinting at a hold.
SNPS Stock Technical Analysis

According to the technical chart, SNPS took a sharp rejection from the upper trendline of $465.76 and broke the 50 EMA line. Moreover, the price was currently heading toward the 200 SMA line.
MACD breached the middle line and headed downwards. MACD line (-2.14) is beneath the signal line (-3.26) indicating bearishness in the stock.
The RSI line is also heading towards an oversold zone, breaching the median line. RSI line (38.78) is beneath the 14 SMA (49.40) line indicating bearishness.
Conclusion
Synopsys stock price is heading downward breaking 50 EMA and towards 200 EMA. Most trustworthy technical indicators like MACD and RSI are indicating a downtrend in SNPS price. Q3 2023 earnings are on the way and will decide the SNPS price destiny in the upcoming days.
Technical Levels
- Support levels: 429.58 and 407.37
- Resistance levels: 469.84 and 487.89
Disclaimer
The analysis provided in this article is for informational and educational purposes only. Do not rely on this information as financial, investment, or trading advice. Investing and trading in stock involves risk. Please assess your situation and risk tolerance before making any investment decisions.

Nancy J. Allen is a crypto enthusiast, with a major in macroeconomics and minor in business statistics. She believes that cryptocurrencies inspire people to be their own banks, and step aside from traditional monetary exchange systems. She is also intrigued by blockchain technology and its functioning. She frequently researches, and posts content on the top altcoins, their theoretical working principles and technical price predictions.


