
 Home
Home News
News
- 1 SOL price is trading above the key moving averages, showing strength.
- 2 Buyers persist in accumulation and are aiming for the $30 mark.
Solana (SOL) price chart shows a bullish voyage out to smash previous levels. Moreover, the SOL price is trading near the upper neckline of the consolidation phase, near $25, which buyers are trying to surpass. If SOL price escapes above $25, it will result in a range breakout which opens the door toward $30, followed by $36 for the upcoming sessions.

However, Solana (SOL) price continued to respect the lower trendline bouncing off of it. Moreover, the price action suggests that SOL price surpassed the 200-day EMA, and buyers can now retest higher swings. SOL price is consolidating in a range and facing the neckline of $26. However, the trend is intact, buyers will soon register a breakout above it which will be reflected by the spike in trading volume.

Recently, the SOL has enlisted a breakout; still, the sellers showed their aggressiveness, and buyers could not sustain it there, resulting in rejection and inverted hammer candlestick noted on the charts.
At press time, Solana (SOL) price is trading at $25.01 with an intraday gain of 2.12% suggesting neutrality. Moreover, the trading volume increased by 3.23% to $633.93 Million, and the pair of SOL/BTC is at 0.000851 BTC. The market cap of SOL is $10.14 Billion. However, analysts maintained a buy rating suggesting a growth outlook. SOL gave weekly returns of 8.14% amid a volatile market indicating strong performance.
Solana (SOL) Price Near $30 On Daily Charts

On the daily charts, Solana (SOL) price shows a positive outlook and is looking for a breakout to revisit the cluster of $30. However, the battle is exciting now, where bulls try at full pace to break the range, whereas bears tighten and prevent the range. This fight explains the price consolidation in the past sessions.
As per the Fib levels, SOL price is trading above 38.2% and near the 50% zone showing the intention to enter the bull territory. Moreover, the bollinger band is squeezing now, and the price is above the mid-range suggesting a breakout is near.
SOL Short Term Charts Reflect Consolidation
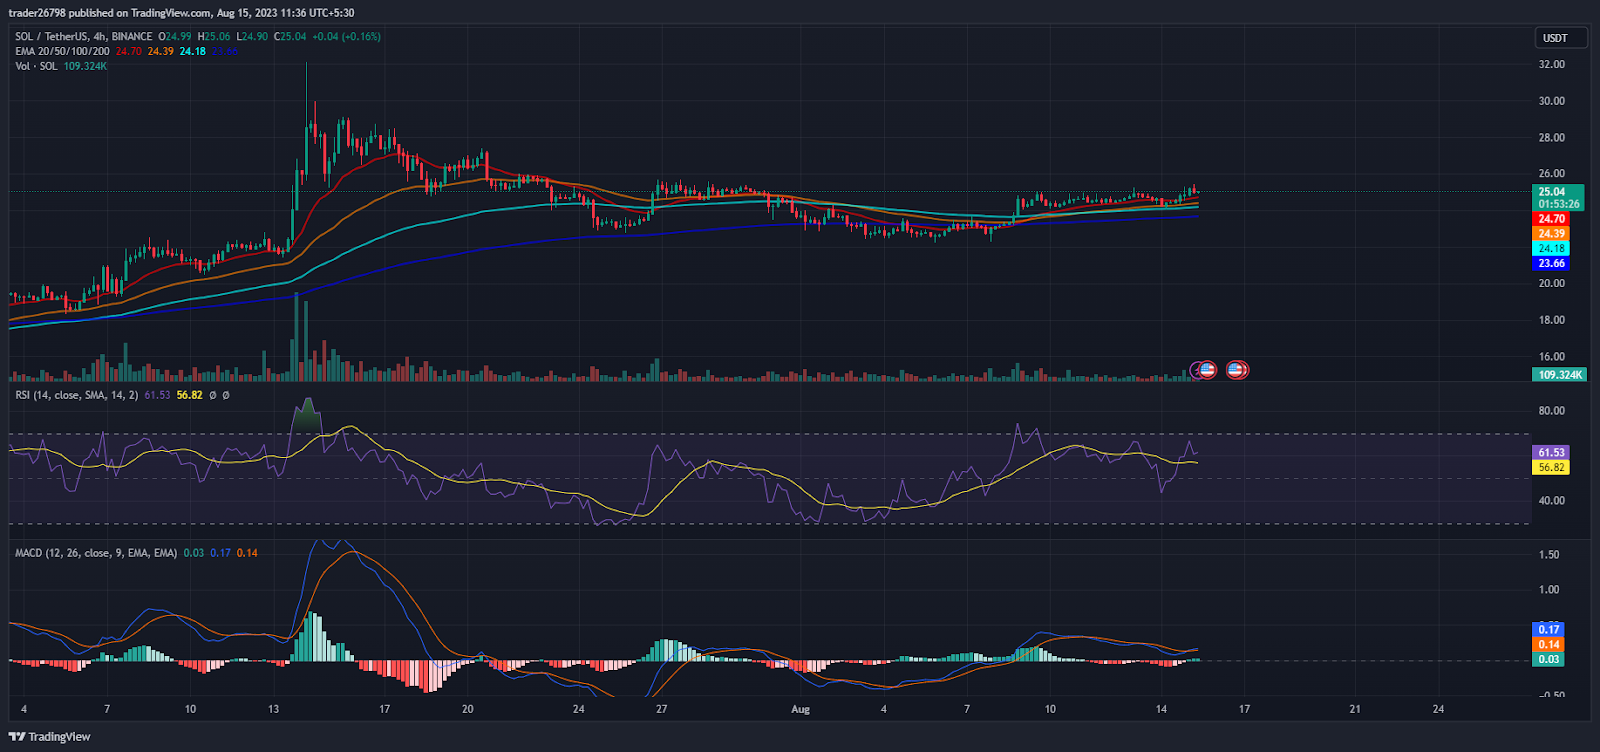
Solana (SOL) price on the short-term charts shows range bound moves hovering near $25, where buyers face a barrier near $26.
The RSI curve is in the overbought zone, and a positive crossover witnessed buyers’ accumulation on the charts.
The MACD indicator showed a bullish crossover and formed green bars on the histogram, reflecting the positive outlook on the charts.
Conclusion:
Solana (SOL) price is trading above the significant moving averages and preparing the muscles to revisit the cluster of $30. Moreover, buyers have persisted in accumulation and are looking forward to a breakout in the upcoming sessions. However, bulls are challenged to escape the range, as sellers have maintained strength and prevented the range.
Technical Levels:
Support Levels: $22 and $20
Resistance Levels: $30 and $36
Disclaimer
The views and opinions stated by the author, or any people named in this article, are for informational purposes only and do not establish financial, investment, or other advice. Investing in or trading crypto assets comes with a risk of financial loss.

Adarsh Singh is a true connoisseur of Defi and Blockchain technologies, who left his job at a “Big 4” multinational finance firm to pursue crypto and NFT trading full-time. He has a strong background in finance, with MBA from a prestigious B-school. He delves deep into these innovative fields, unraveling their intricacies. Uncovering hidden gems, be it coins, tokens or NFTs, is his expertise. NFTs drive deep interest for him, and his creative analysis of NFTs opens up engaging narratives. He strives to bring decentralized digital assets accessible to the masses.


