
 Home
Home News
News
- 1 The graph price is currently trading at $0.1071 while witnessing a loss of -1.65% during the intraday session.
- 2 Messari, a crypto research firm, releases the Q2 report of The Graph.
GRT price has been in a downtrend since the formation of high at $0.1438 which was the result of a bullish rally commenced in June. The bullish rally was initiated during the middle of June after BlackRock, an investment banking firm, filed for Bitcoin Spot ETF.
The cryptocurrency price crossed above the $0.14 level but could not sustain above it. The rejection ignited a bearish momentum in the price and it started to form lower lows. Recently, GRT price formed support at $0.1045 after melting down.

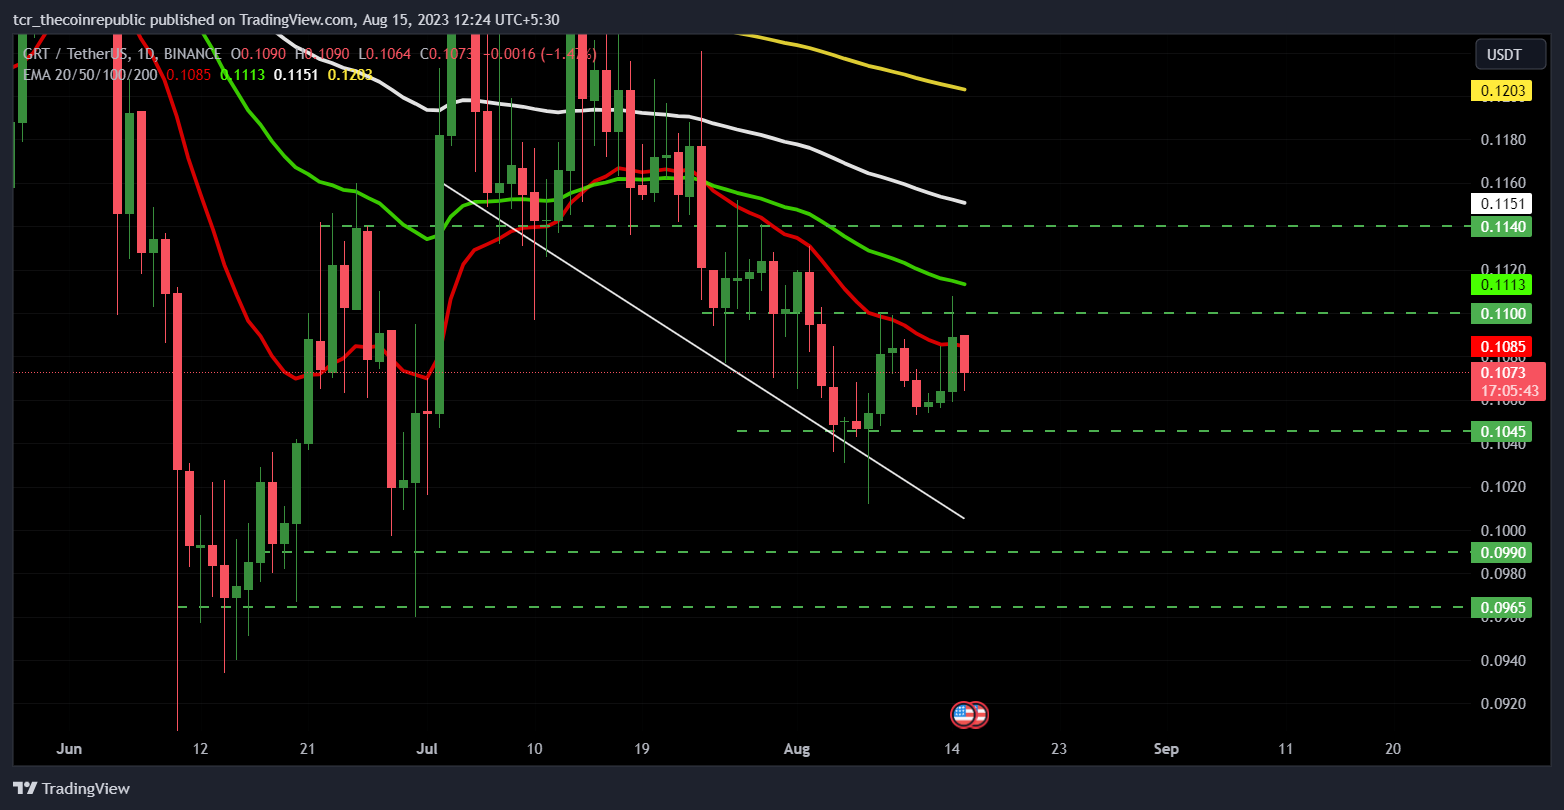
GRT price has been stuck in a narrow consolidation zone ranging between $0.11 and $0.1045 since the start of August. If the price can break above $0.11, it might head toward the next resistance level of $0.1140.
On the other hand, if the price breaks below the recent support of $0.1045, it might melt down to the next support level of $0.0990. The bulls are protecting the price from melting down below $0.10.
Quarter 2 Key Insights
The demand side revenue of The Graph has decreased by 48% quarter on quarter which is driven by Dapps optimizing query volumes and an overall reduction in usage from governance activities and decentralized infrastructure.
The revenue generated from indexing rewards hiked by 3% quarter over quarter to more than $9 million. Active indexers of The Graph decreased 29% quarter on quarter, while there is an increase of 2% and 3% in delegators and curators respectively.
The revenue from usage fees is $46,577 and the revenue from indexing rewards is $9,068,795. In quarter 2, the graph has completed phase 2 of its migration to Arbitrum, a layer 2 scaling solution. Phase 2 enables indexing rewards on Arbitrum One.
Will GRT Price Sustain Above $0.10?
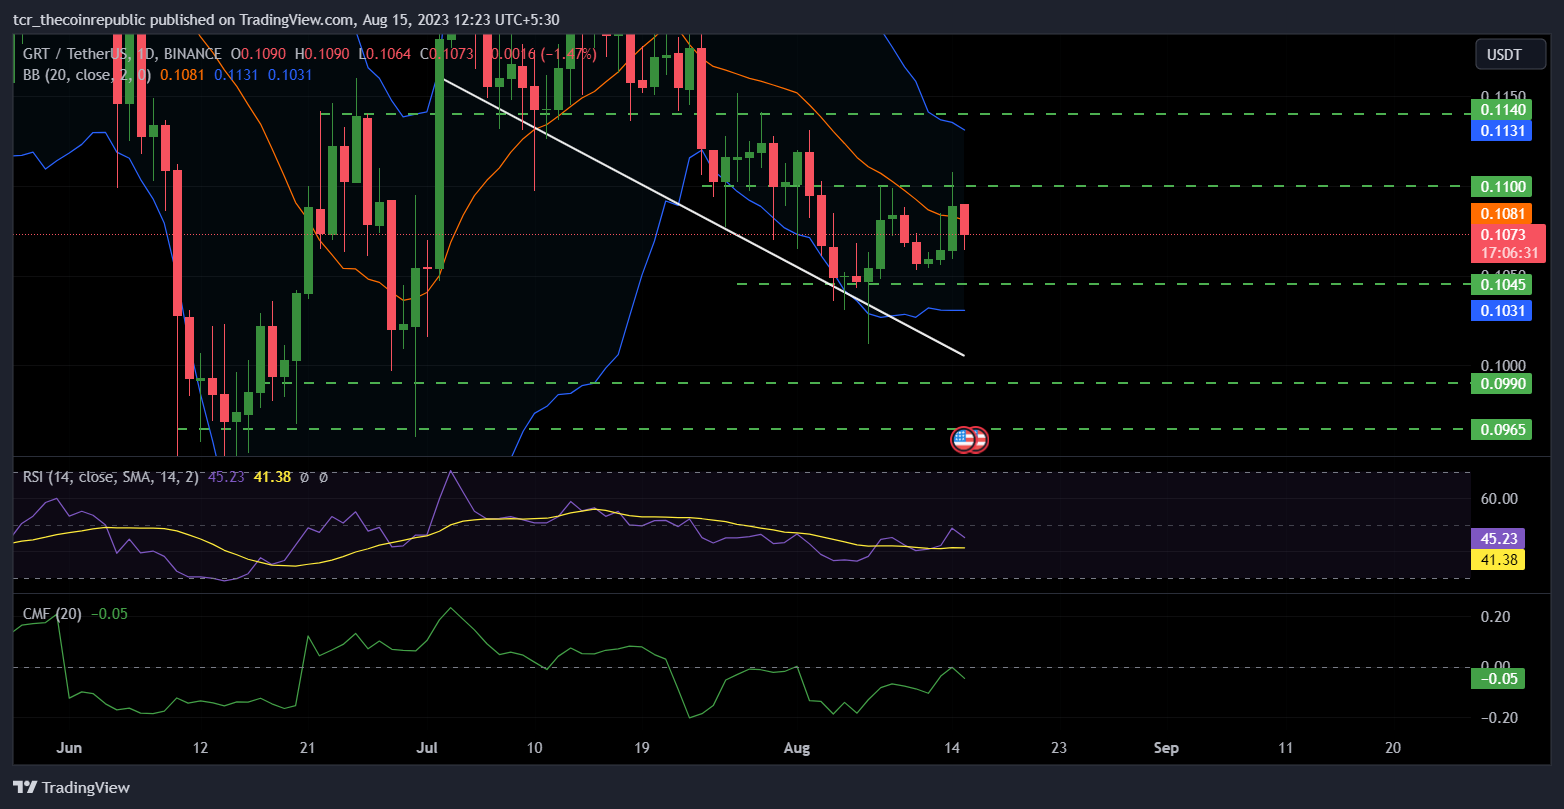
The cryptocurrency price has melted below 20, 50, 100, and 200-day exponential moving averages, suggesting bearish momentum. Chaikin money flow score has dropped below the 0 mark indicating rising weakness in the market.
The relative strength index has also dropped below the 50 mark and currently trades at 45.44 indicating a rise in bearish momentum. The Bollinger bands have also contracted implying a decrease in volatility.
GRT price is facing rejection from the 20-day simple moving average and is toward the lower band of Bollinger which resides at $0.1031. The long/short ratio is 0.73 with 42.42% longs and 57.58% shorts indicating the dominance of bears in the last 24 hours.
Conclusion
The market structure and price action of The Graph are indecisive as the price is stuck in a narrow consolidation zone. Technical parameters indicate that there is a rise in bearish pressure and the possibility of a breakout if bearish dominance prevails.
Technical levels
Major support: $0.0990 and $0.0965
Major resistance: $0.1100 and $0.1140
Disclaimer
The views and opinions stated by the author, or any people named in this article, are for informational purposes only. They do not establish financial, investment, or other advice. Investing in or trading crypto assets comes with a risk of financial loss.
Steve Anderson is an Australian crypto enthusiast. He is a specialist in management and trading for over 5 years. Steve has worked as a crypto trader, he loves learning about decentralisation, understanding the true potential of the blockchain.


