
 Home
Home News
News

- 1 Bitcoin (BTC) price slid down by 2.06% in the past 24 hours and is currently trading at $29154.20.
- 2 Bitcoin (BTC) price formed a double-top pattern followed by a consolidation showing weakness on the daily chart.
Bitcoin (BTC) price may undergo a sharp fall as the price is showing bearishness on the charts. Investors are getting pessimistic as time passes. The price action formed on the charts seems to be creating a favorable condition for the sellers to enter the market.

The analysts are cautious over the pattern being formed on the charts as the price seems to be topping out followed by a consolidation near the trendline support. The trendline support might be the last optimistic zone for the buyers.

If the BTC price manages to breach and starts trading below the zone, then sellers may try to take control and might break below the neckline of the double-top pattern and drag the pierce below the $20000 mark.
BTC is the oldest crypto and the market leader with a dominance of 49.1% in the crypto world. Upholding a market cap of over $1 Trillion in 2021, it reached a record high of $64,863.10 on April 14, 2023.
This is partly due to the growing demand from institutional investors, and the widespread availability of platforms that offer BTC-related services, such as wallets, exchanges, payments, games, and more.
Bitcoin Price Consolidating Near the Last Hope of the Buyers
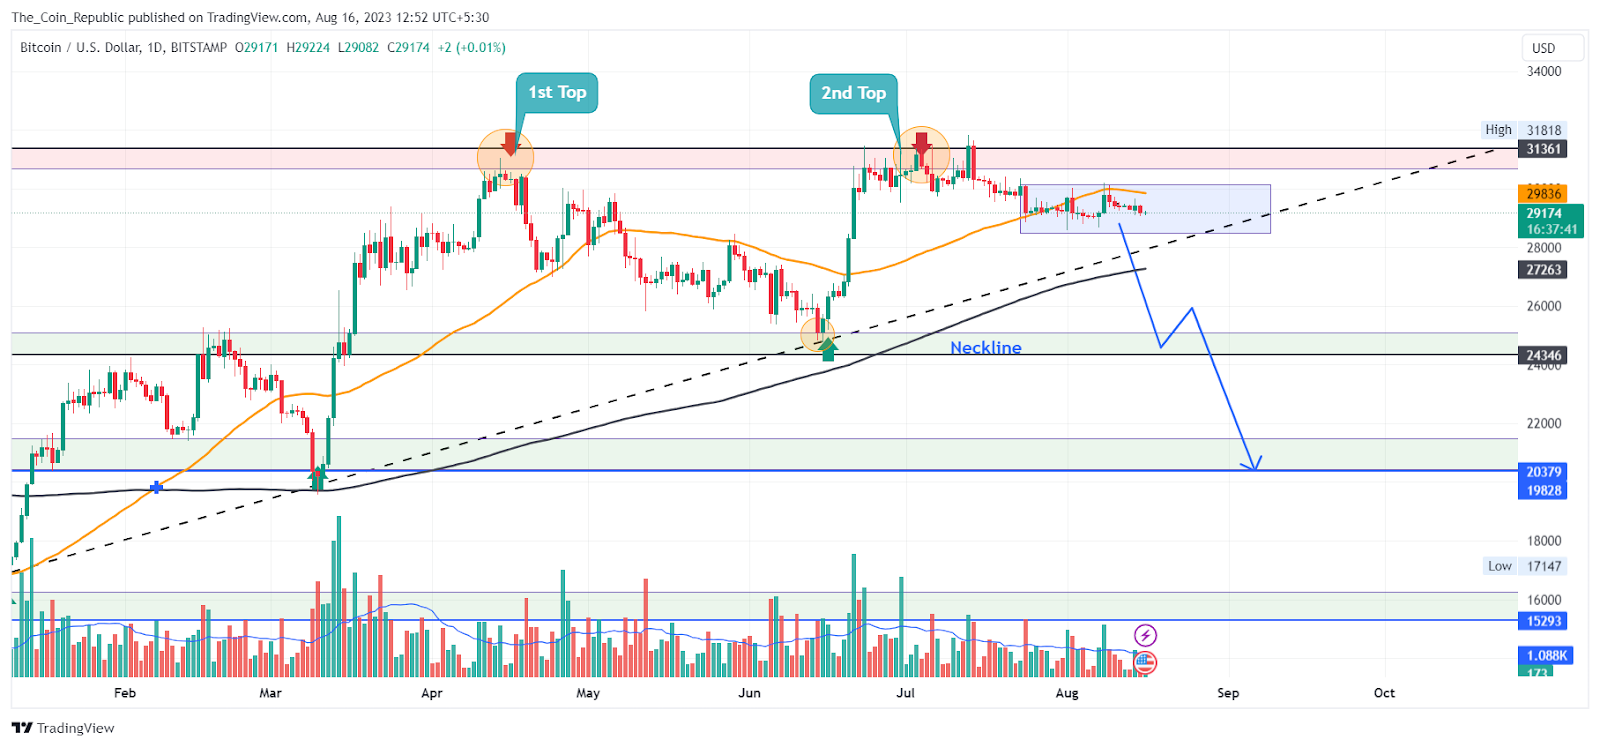
The Bitcoin price currently trades at $29154.20 and is consolidated near the previous trendline support.
The short-term outlook for the Bitcoin (BTC) price stays neutral until the price manages to stay above the trendline support. The trendline support might be the last hope of the buyers the breakdown of which may initiate a sharp downside movement in the coin as per the analysts.
RSI and MACD Indicators Showing a Bearish Divergence to the Double-Top Formation
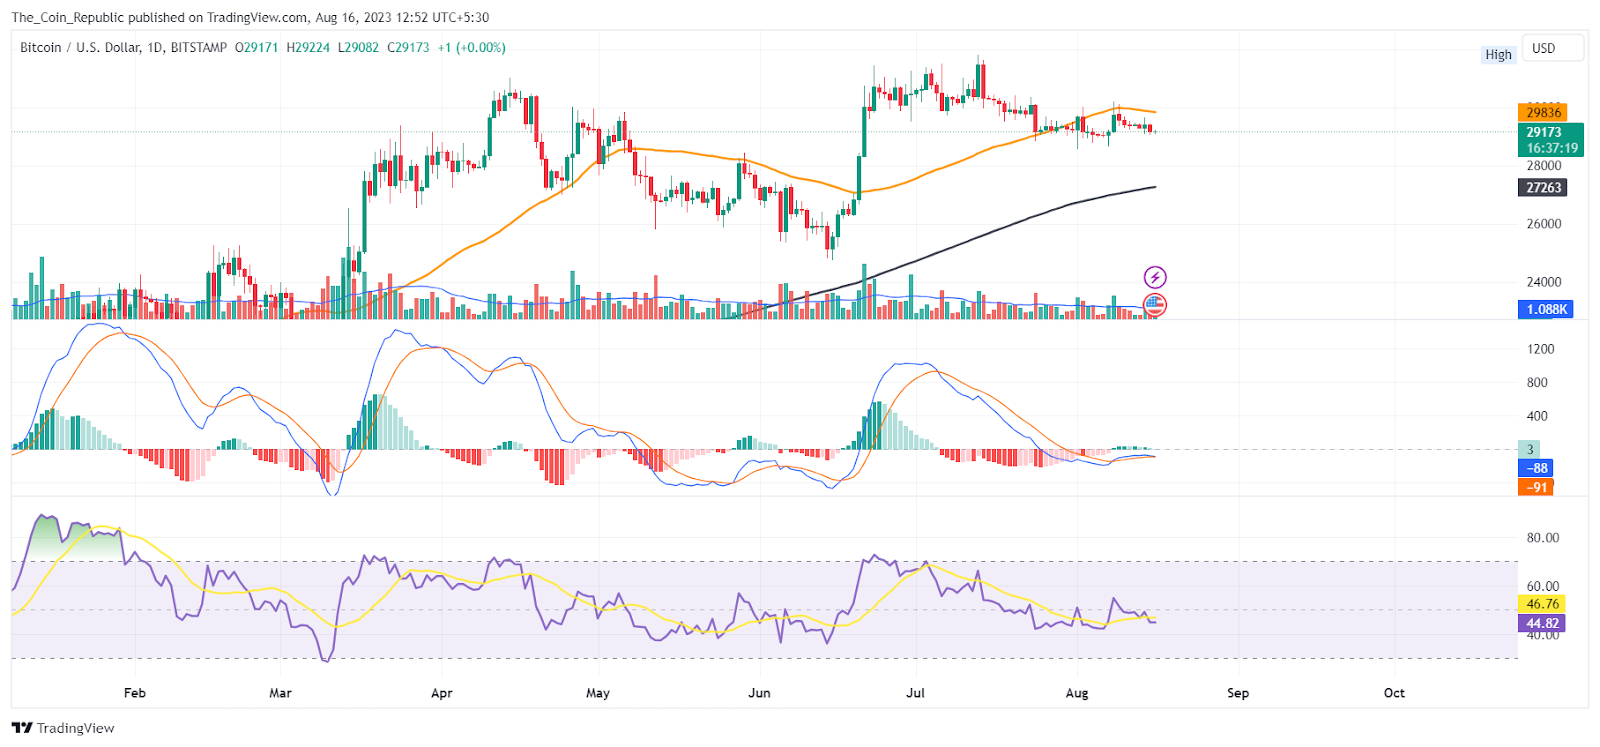
MACD and RSI indicators are showing a bearish divergence which signals the loss of momentum in buying and the price might take a dip if the selling volume enters the market.
The EMA analysis shows that the BTC price failed to sustain above the 50 EMA, indicating the dominance of the sellers in the market in the short-term and turning into a long-term bearishness if the price falls below the 200 EMA.
Conclusion
Bitcoin price prediction concludes that the price is showing signs of weakness and may drop sharply. Investors are losing confidence as the price consolidates near the trendline support. The price may form a double-top pattern and break below the $20000 level if the support is breached. The Bitcoin price is currently at $29154.20 and is near the critical support zone. The short-term outlook is neutral as long as the price stays above the support. The support may be the last chance for the buyers.
Technical Levels
- Support levels: $24346 and $20379
- Resistance levels: $31361 and $34945
Disclaimer
The views and opinions stated by the author, or any people named in this article, are for informational purposes only and do not establish financial, investment, or other advice. Investing in or trading crypto or stock comes with a risk of financial loss.

Nancy J. Allen is a crypto enthusiast, with a major in macroeconomics and minor in business statistics. She believes that cryptocurrencies inspire people to be their own banks, and step aside from traditional monetary exchange systems. She is also intrigued by blockchain technology and its functioning. She frequently researches, and posts content on the top altcoins, their theoretical working principles and technical price predictions.


