
 Home
Home News
News
- 1 The Litecoin network coin’s price decreased by 6.13% over the last week and it is trading below all major EMA’s.
- 2 The price of the LTC coin is trading at $78.69 and the 52-week range is $63 – $114.
The LTC coin has not performed well in the last month, decreasing by 15.26% and by 19.86% in the last six months. Litecoin Network (BITSTAMP: LTC) coin has a positive year-to-date return of 12.46% and a positive one-year return of 29.57%.
Litecoin Network crypto plummeted by 3.45% in market value and surged by 71.07% in trading volume in the last 24 hours, as per CoinMarketCap, a crypto data analysis website. Its market value is $5,797,240,727 and its trading volume is $435,048,413. There are 73,547,189 LTC in circulation.

Litecoin coin’s (LTC) open interest is $446.01 Million. As per Coinglass, another crypto analysis website, it fell by 5.38% in the previous session. The long versus short ratio for 24 hours is 0.8861. The short liquidation is $6.37K versus $1.13 Million for the long liquidation.
LTC Coin Price Technical Analysis in the 1-Day Timeframe
LTC coin price showed a downward trend for the past three months, decreasing by 16.21% during this period.
At the time of publication, the LTC coin price is trading at $78.80, and the price is facing selling pressure and falling from $114.57 and the recent nearest resistance is around $82.79. If more selling volume adds, then the breakdown might drag the price toward new lows.
Therefore, if it fails to maintain the current level, the LTC coin price could continue to move downwards and reach the nearest support at $71.37 and $63.26.
However, if the LTC coin price sustains the current level and rises, then it might hit the nearest resistance levels of $82.79 and $94.78.
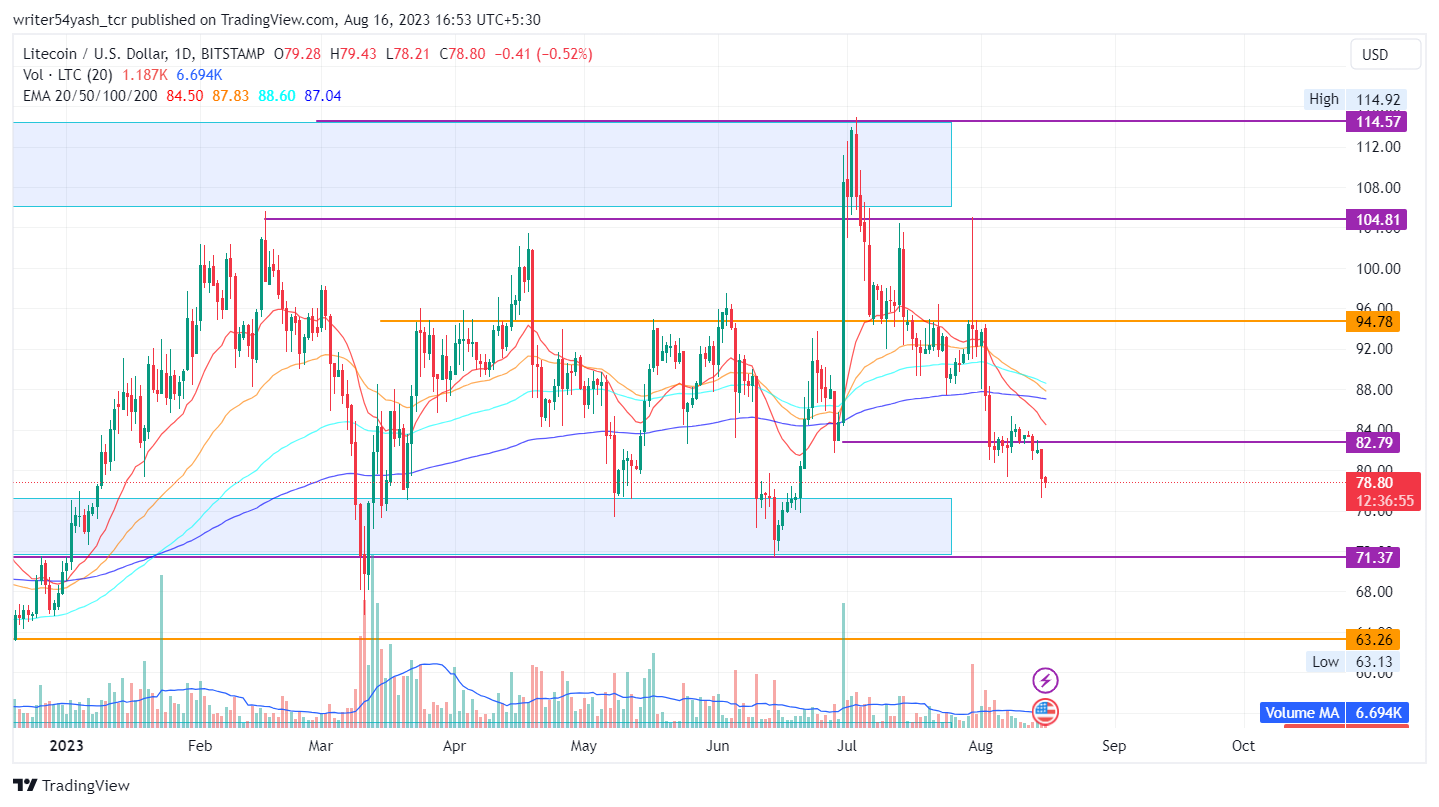
At the time of publishing, the LTC coin price (LTC) is trading below the 20, 50, 100, and 200-day EMAs (exponential moving averages), which are rejecting the LTC Coin price trend.
Hence, LTC coin price prediction estimates the prices to move downwards, indicating a bearish outlook over the daily time frame chart for its price.
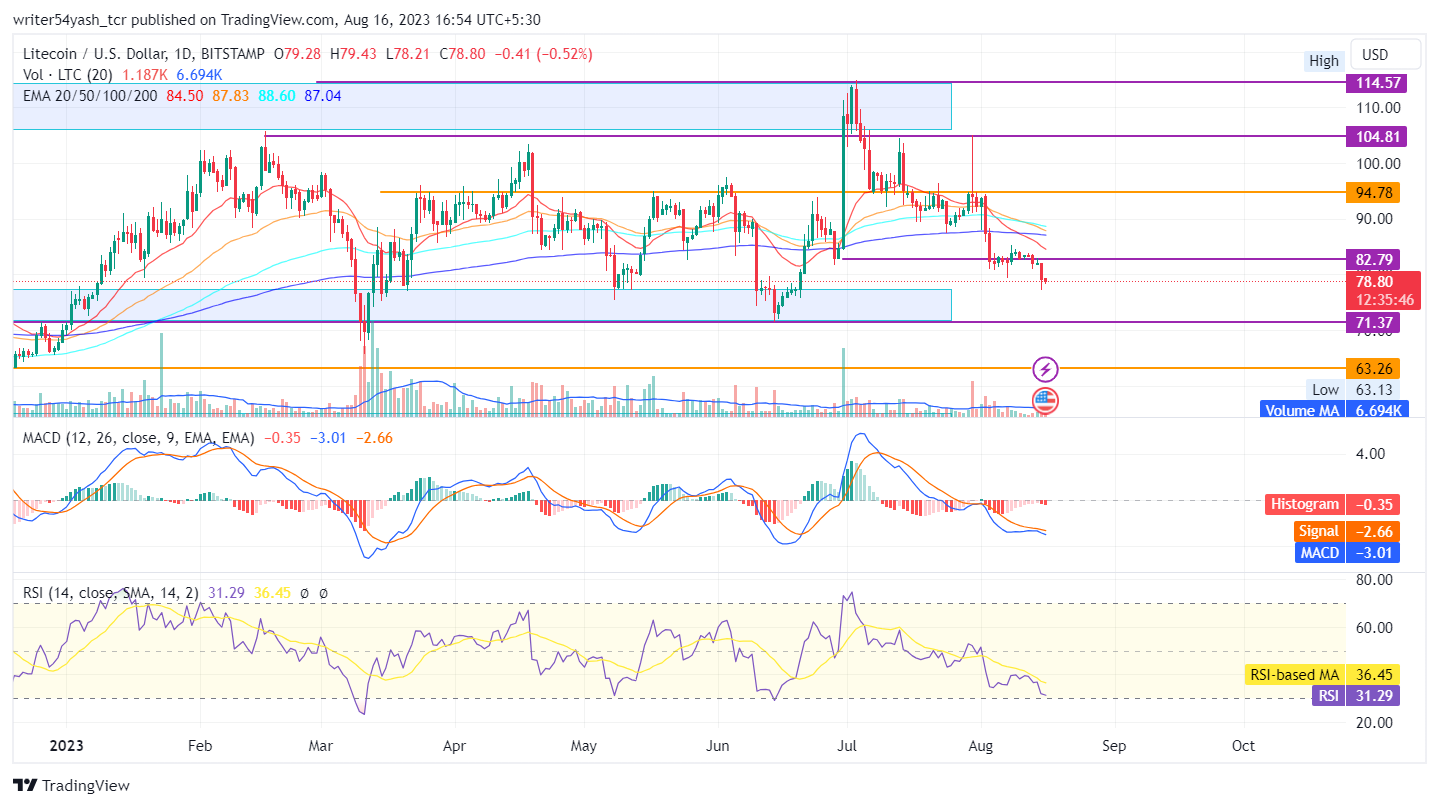
The MACD line at 3.01 and the signal line at 2.66 is below the zero line both lines crossed down to each other and a bearish crossover is observed in the MACD oscillator, suggesting bearish signals.
The current value of the RSI is 31.29 points and the 14-day SMA is below the median line at 36.45 points, which indicates bearish sentiments as RSI took rejection on the 14 SMA line and headed for the oversold zone in the market for the LTC coin, highlighting bearishness.
Conclusion
LTC coin price prediction highlights the bearish sentiments and perspectives of investors and traders regarding the LTC coin in the daily time frame. Litecoin price action highlights a bearish view at the time of publishing. Moreover, the technical parameters of the Litecoin price suggest the continuation of the downtrend over the daily time frame chart. Major trustworthy indicators MACD, RSI, and EMA, provide negative signals regarding the LTC coin price.
Technical Levels:
- Support levels: $71.37 and $63.26
- Resistance levels: $82.79 and $94.78
Disclaimer
In this article, the views and opinions stated by the author, or any people named are for informational purposes only, and they don’t establish the investment, financial, or any other advice. Trading or investing in cryptocurrency assets comes with a risk of financial loss.

With a background in journalism, Ritika Sharma has worked with many reputed media firms focusing on general news such as politics and crime. She joined The Coin Republic as a reporter for crypto, and found a great passion for cryptocurrency, Web3, NFTs and other digital assets. She spends a lot of time researching and delving deeper into these concepts around the clock, and is a strong advocate for women in STEM.


