
 Home
Home News
News
- 1 Exxon Mobil Corporation has a market capitalization of $432.985 Billion.
- 2 XOM stock is expected to approach the $112.07 resistance level followed by $115.81.
NYSE: XOM stock price fell over 2.57% on the August 16 trading session. The opening price was $108.17, lowest price was $107.97; highest price was $108.26. The stock closed at $107.98 with an intraday trading volume of $67.947k.
In the 52 weeks time frame, XOM share’s highest price was $119.92, the lowest trading price was $83.89. Technical aspects of XOM stock show that XOM shares were trading lower than its annual price target of $120.91.

Exxon Mobil Corporation has a market capitalization of $432.985 Billion, with an average trading volume of 14.822 Million. Despite intraday losses, XOM stock surged more than 2% in a week and 3.95% in a month.
XOM Stock Price Analysis
Excluding the August 15 trading session, XOM stock added more than $1.50 in two trading sessions. In the first half of the trading session, sellers were on top of the buyers, but by the end of the session, sellers lost their position, and buyers started ruling, helping XOM stock price sustain near the support level.
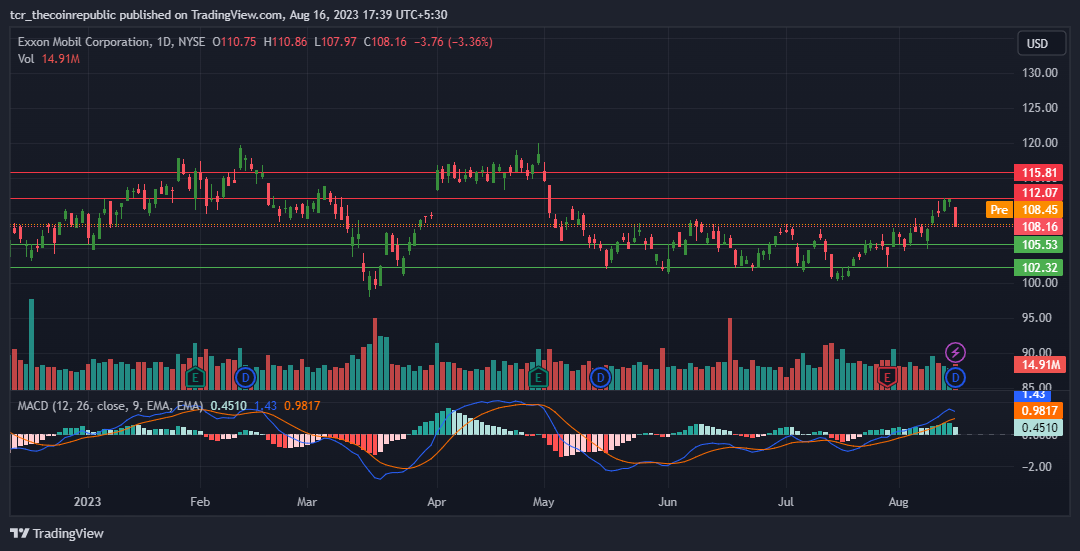
Per the technical aspects of XOM stock, it was noted that if buyers continued their dominance over the coming session, its price might face immediate support of $105.53 and the next possible support of $102.32.
Following this decline, analysts claim that buyers will likely dominate sellers in the August 16 trading session. In this case, XOM stock price will face an approaching resistance of $112.07 and the next possible resistance of $115.81, but as per expectation, prices will not sustain for a long time on the $115 resistance.
The decline of August 15 has troubled numerous investors, and financial analysts claim that bulls will try hard to push bears sidewards to clear and recapture their positions. In the pre-market trading sessions, XOM stock might open higher than its last closing price.
Exxon Mobil Corporation Earnings and Revenue
In Q1 & Q2 2023, Exxon Mobil Corporation reported 1.07% and 1.36% more revenue than estimated figures; the company was supposed to report $85.65 Billion in Q1 and $81.80 Billion in revenue in Q2 2023.
According to TradingView, 3.998 Billion XOM shares are free-floating, and the remaining 5.492 Million shares are closely held by the company’s financial backers or board of directors.
The company’s reported revenue for 2022, including gross profit, was 26% with earnings before interest, taxes, depreciation, and amortization (EBITDA), 16% earnings before interest and taxes (EBIT), and 14%.
Most revenue is generated from the Energy business, Chemical Business, Corporate & Financing, Upstream, and Speciality.
Technical Levels
Resistance Levels: $112.07 and $115.81
Support Levels: $105.53 and $102.32
Conclusion
XOM stock lost more than $1 of its trading price on August 15, which stirred the sentiments of XOM shareholders. However, analysts believe that the recent decline will not hold XOM share price longer at a lower level, and a possible reversal may be seen by the end of this week.
Disclaimer
The views and opinions stated by the author, or any people named in this article, are for informational ideas only and do not establish financial, investment, or other advice. Investing in or trading crypto assets comes with a risk of financial loss.

Andrew is a blockchain developer who developed his interest in cryptocurrencies while pursuing his post-graduation major in blockchain development. He is a keen observer of details and shares his passion for writing, along with coding. His backend knowledge about blockchain helps him give a unique perspective to his writing skills, and a reliable craft at explaining the concepts such as blockchain programming, languages and token minting. He also frequently shares technical details and performance indicators of ICOs and IDOs.


