
 Home
Home News
News
- 1 Dogecoin crypto price was $$0.06764 at press time.
- 2 The crypto shed 3.35% in the last 24 hours with a market cap of $9.51 Billion.
Dogecoin is making the lower lows structure and has entered the bearish momentum. On Sunday 13 August 2023, the DOGE price broke the 200 EMA with a strong red candle and on Tuesday 15, it broke the 50 EMA support and entered a bearish trend.
In the recent weeks, the volume has been down. The 24-hour trading volume of DOGE is 5.613 Million which is less than the average 10 days volume of the coin which is (20.784 Million).
The current market cap of the coin is $9.52 Billion and the fully diluted market cap of DOGE is $9.52 Billion with a circulating supply of 140.624 Billion.
On the weekly time frame, DOGE was rejected from the 200 Days EMA line demonstrating the Bearish trend in the coin which could continue in the long term.
The MACD in the weekly time frame is beneath the zero line indicating bearishness in the DOGE while the RSI is in the neutral zone. However, the RSI line smashed through the 14 SMA line from above, indicating bearishness.
Technical Analysis of Dogecoin Crypto Price in 1-D Timeframe
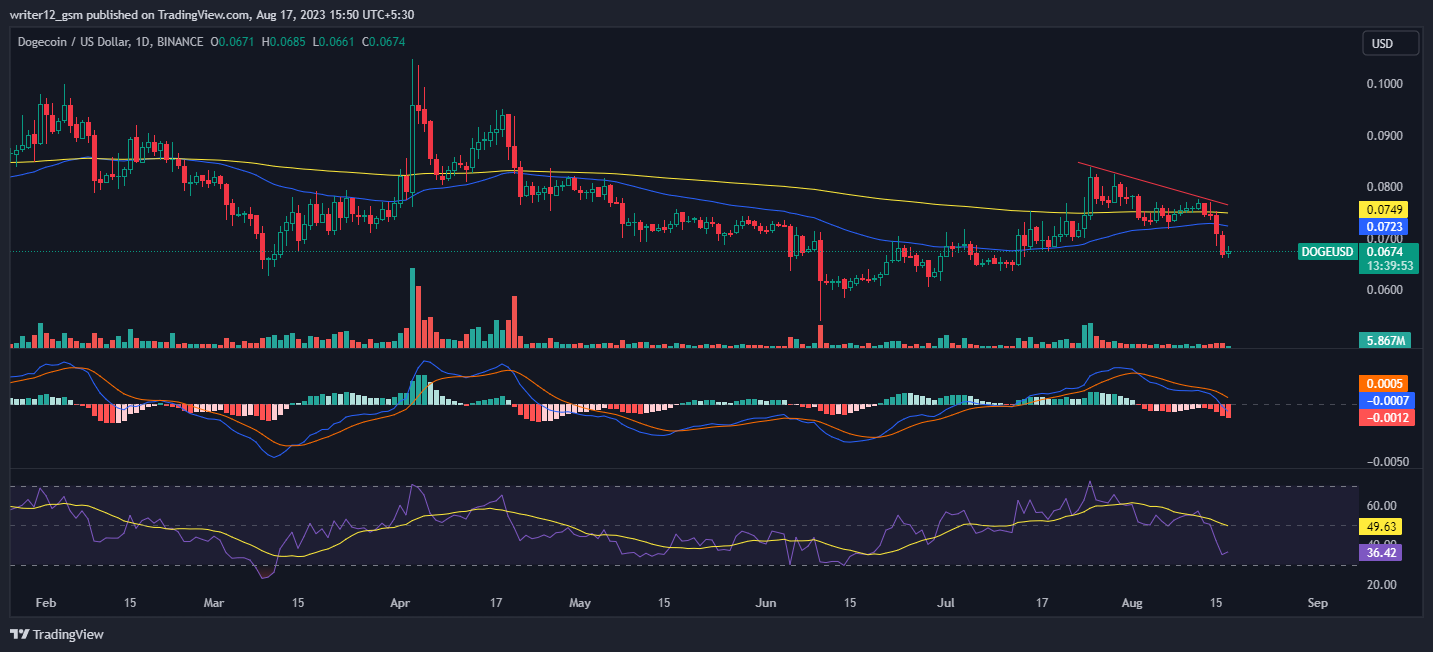
If it can maintain this level, the Dogecoin price could hit the first and second targets of $0.0866 and $0.0953, respectively. However, if the DOGE price cannot maintain this level and falls, then it might hit the closest support levels of $0.0663 and $0.0547.
At the time of publishing, Dogecoin crypto (USD: DOGE) is trading above the 50 and 200-day exponential moving averages, which are supporting the price trend.
However, if more selling volume adds up, then the price might conquer supporting SMAs by making lower highs and lows. Hence, the DOGE price is expected to move downwards giving bearish views over the daily time frame chart.
The current value of RSI is 35.86 points. The 14 SMA is above the median line at 49.58 points which indicates that the Dogecoin crypto is bearish.
The MACD line at 0.0005 and the signal line is at -0.0007. A bearish crossover is observed in the MACD indicator which signals more bearishness for the DOGE crypto price.
Summary
Dogecoin (USD: DOGE) technical oscillators support the bearish trend. The MACD, RSI, and EMA emphasize negative signs and imply that the downtrend may continue in the DOGE crypto price. Dogecoin price action suggests that the investors and traders are bearish on the 1-D time frame. The price action reflects a bearish perspective at the moment.
Technical Levels
- Support Levels: The nearest support levels for the Dogecoin crypto price are $0.0663 and $0.0547.
- Resistance levels: The nearest resistance levels for the DOGE crypto price are $0.0866 and $0.0953.
Disclaimer
The analysis provided in this article is for informational and educational purposes only. Do not rely on this information as financial, investment, or trading advice. Investing and trading in crypto involves risk. Please assess your situation and risk tolerance before making any investment decisions.
Steve Anderson is an Australian crypto enthusiast. He is a specialist in management and trading for over 5 years. Steve has worked as a crypto trader, he loves learning about decentralisation, understanding the true potential of the blockchain.


