
 Home
Home News
News

- 1 IOTA’s crypto price decreased by 2.56% over the past seven days.
- 2 IOTA crypto price is currently trading at $30.266447 with a drop of 0.66% in the last 24 hours with a current market cap of $781.563 Million.
- 3 IOTAUSD is under bearish pressure.
The MIOTA price analysis shows that the crypto is attempting to smash the upper trendline on the daily time frame chart but has failed repeatedly. IOTA crypto needs an uptick in momentum in order to break out from the descending pattern.

Bears may approach the 50-EMA resistance. Nevertheless, the 24-hour trading volume is 25.595K, lower than the 10-day average volume of 242.704K.

MIOTA price forecast suggests that investor presumptions regarding the IOTA token are bearish. Investors may prefer to keep a keen watch over the crypto. Presently, the IOTAUSD price is below all the key EMA and MA levels.
The IOTA Crypto price prediction indicates the token produced an interesting declining pattern. Crypto struggles to move above 20, 50, 100, and 200-day daily moving averages.
The present value of IOTA is $0.1549. It has a market capitalization of around $430.549 Million with a fully diluted market cap of $430.549 Million. The crypto has a circulating supply of 2.78 Billion.
Technicals signal selling pressure while the technical oscillators indicate neutrality. The moving averages are also on the strong sell side. This shows bearish dominance in the market.
MIOTA has performed poorly so far this year. Year-over-year returns are -8.42% while returns over the past 6 months are -36.93%. The return was -19.99% last month and -10.90% last week.
Technical Analysis of IOTA Crypto Price
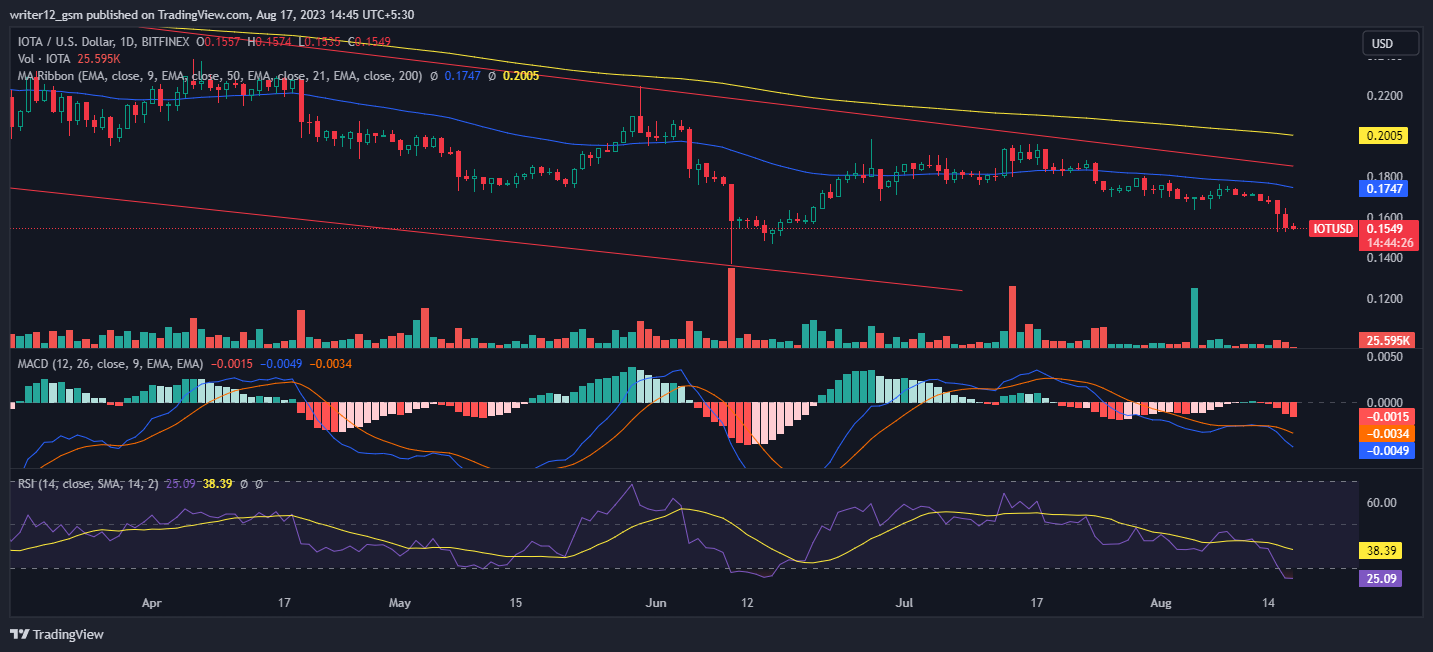
At the time of publishing, MIOTA crypto (USD: IOTA) is trading below the 50, 100, and 200-day simple moving averages, signaling bearish momentum.
However, if more selling volume adds up, then the price might conquer supporting SMAs by making lower highs and lows. Hence, the IOTA price is expected to move downwards giving bearish signals over the daily time frame chart.
The current value of RSI is 25.09 points. The 14 SMA is below the median line at 38.39 points which indicates that the MIOTA crypto is bearish.
The MACD line at -0.0049 and the signal line at -0.0034 are above the zero line. A bearish crossover is observed in the MACD which signals more bearishness for the IOTA crypto price.
Summary
IOTA (USD: IOTA) technical indicators also support the bearish trend. The MACD, RSI, and EMA are giving negative signs and imply that the downtrend may continue in the IOTA crypto price. IOTA price action suggests that the investors and traders are bearish on the 1-D time frame. The price action reflects a bearish perspective at the moment.
Technical Levels
- Support Levels: Immediate support levels are $0.1640 and $0.1539
- Resistance Levels: Immediate resistance levels are $0.1904 and $0.2066.
Disclaimer
The analysis provided in this article is for informational and educational purposes only. Do not rely on this information as financial, investment, or trading advice. Investing and trading in crypto involves risk. Please assess your situation and risk tolerance before making any investment decisions.

Adarsh Singh is a true connoisseur of Defi and Blockchain technologies, who left his job at a “Big 4” multinational finance firm to pursue crypto and NFT trading full-time. He has a strong background in finance, with MBA from a prestigious B-school. He delves deep into these innovative fields, unraveling their intricacies. Uncovering hidden gems, be it coins, tokens or NFTs, is his expertise. NFTs drive deep interest for him, and his creative analysis of NFTs opens up engaging narratives. He strives to bring decentralized digital assets accessible to the masses.


