
 Home
Home News
News

- 1 VLO stock price is above the key moving averages, delivering a positive outlook.
- 2 Buyers persist in accumulation and look to surpass $140.
Valero Energy Corporation (VLO stock) is trading in the bull territory and will soon retest the previous swing of $140 in the following sessions. Moreover, the price action is favors a rise, and the stock has revamped from the support zone of $100, noting a V-shaped recovery. Furthermore, the bulls have attained their resilience and held the gains. However, the chart showcased the roller coaster moves and being in the narrow range. Recently, VLO stock posted Q2 earnings. The reported figures were above the estimates, favoring bulls to extend the up move toward $150.
Valero (VLO) stock is trading in the buying zone and above the 20-day EMA, showing bullishness on the charts. Moreover, the chart shows buyer dominance and indicates a trendline breakout in the last sessions. However, the stock has retested the zone and is ready for a bounce to surpass the neckline of $140. VLO stock has maintained strength and momentum in the past sessions and is ready to outperform.

At press time, VLO stock price is trading at $130.94 with an intraday drop of 0.15% showing neutrality in yesterday’s session. Moreover, the trading volume remained at 3.503 Million, and the market cap is $46.239 Billion. However, analysts maintained a buy and overweight rating with a yearly target price of $147.05, suggesting a positive outlook.
Valero Energy Corp. engages in the manufacture and marketing of transportation fuels and other petrochemical products. It operates through the following business segments: Refining, Ethanol, and Renewable Diesel.
The Refining segment consists of refining operations, associated marketing activities, and logistics assets that support its refining operations. The Ethanol segment includes its ethanol operations, associated marketing activities, and logistics assets that support its ethanol operations. The Renewable Diesel covers the operations of Diamond Green Diesel Holdings LLC.
VLO Stock Shows Trendline Breakout On Daily Charts
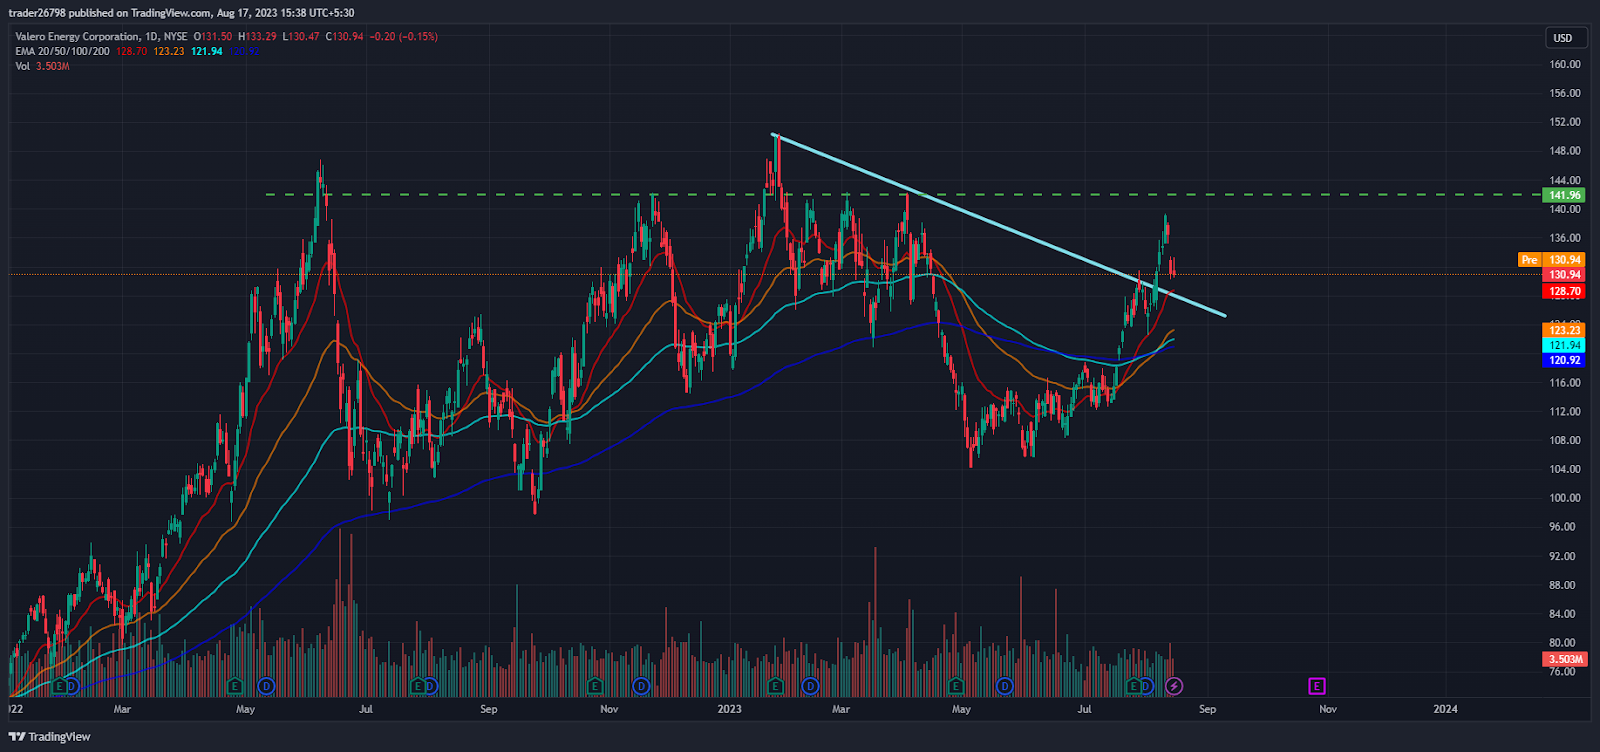
On the daily charts, VLO stock price broke out of the upper trendline and is close to the hurdle of $140. Moreover, the stock surpassed the 61.8% fib level while the price is near the upper bollinger band, which suggests a positive outlook on the charts.
What Technical Indicators Suggest?

On the 4-hour chart, VLO stock showed a trendline breakout but could not extend the gains and retested the $130 mark.
The RSI curve fell from the overbought zone to neutrality, forming a negative crossover on the charts. However, it shows a bullish divergence and suggests a rise in the following sessions.
The MACD indicator showed a bearish crossover and noted red bars on the histogram indicating profit booking in the past sessions.
Conclusion
Valero Energy Corporation (VLO stock) price has shown a trendline breakout and is ready to surpass the $140 hurdle in the following sessions. Moreover, the price action favors the bulls who have dominated in the past few session.
Technical Levels:
Support Levels: $125 and $110
Resistance Levels:$140 and $150
Disclaimer
The views and opinions stated by the author, or any people named in this article, are for informational purposes only and do not establish financial, investment, or other advice. Investing in or trading crypto assets comes with a risk of financial loss.

Nancy J. Allen is a crypto enthusiast, with a major in macroeconomics and minor in business statistics. She believes that cryptocurrencies inspire people to be their own banks, and step aside from traditional monetary exchange systems. She is also intrigued by blockchain technology and its functioning. She frequently researches, and posts content on the top altcoins, their theoretical working principles and technical price predictions.


