
 Home
Home News
News

- 1 Bitcoin’s crypto price decreased by 10.15% over the past seven days.
- 2 At press time, BTC price was $26436 with a drop of 0.77% in the last 24 hours; market cap was $514.466 Billion.
- 3 Bitcoin is under bearish pressure amid news of SpaceX sale of BTC.
Bitcoin fell off after Wall Street Journal reported that SpaceX sold off its Bitcoin holding worth $373 Million.

The Bitcoin Crypto price prediction suggests the coin flipped downturn. The crypto is struggling to move above 50, 100, and 200-day daily moving averages.

The BTC price prediction shows that the coin holders’ sentiments are on the downside. Bitcoin needs an increase in positive momentum in order to bounce back from the current level. However, sellers may approach 50-SMA which is acting as a resistance to the crypto price.
Investor sentiments regarding Bitcoin are bearish. Investors may prefer to keep a keen watch over the crypto. Presently, the BTCUSD price is below all the key EMA and MA levels. at present is trading near the value of $26412. It has a market capitalization of around $514.389 Billion with a fully diluted market cap of $555.072 Million. The crypto has a circulating supply of 19.461 Million.
BTC has taken a pause after performing well so far this year. Year-over-year returns are 59.90% while returns over the past 6 months are 7.28%. The return was -11.49% last month and -10.17% last week. Technicals signal selling pressure while the technical oscillators indicate bearishness. The moving averages are also on the strong sell side. This shows bearish dominance in the market.
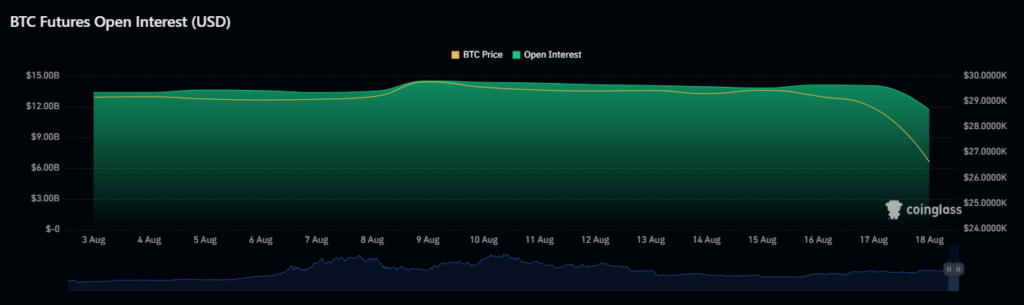
BTC Futures Open Interest (USD) faced a sudden decline. On August 16, 2023, the open interest was $14.12 Billion which dropped and on August 18, 2023 it is $11.66 Billion at the price of $26608.
Technical Analysis of Bitcoin Crypto Price in 1-D Timeframe
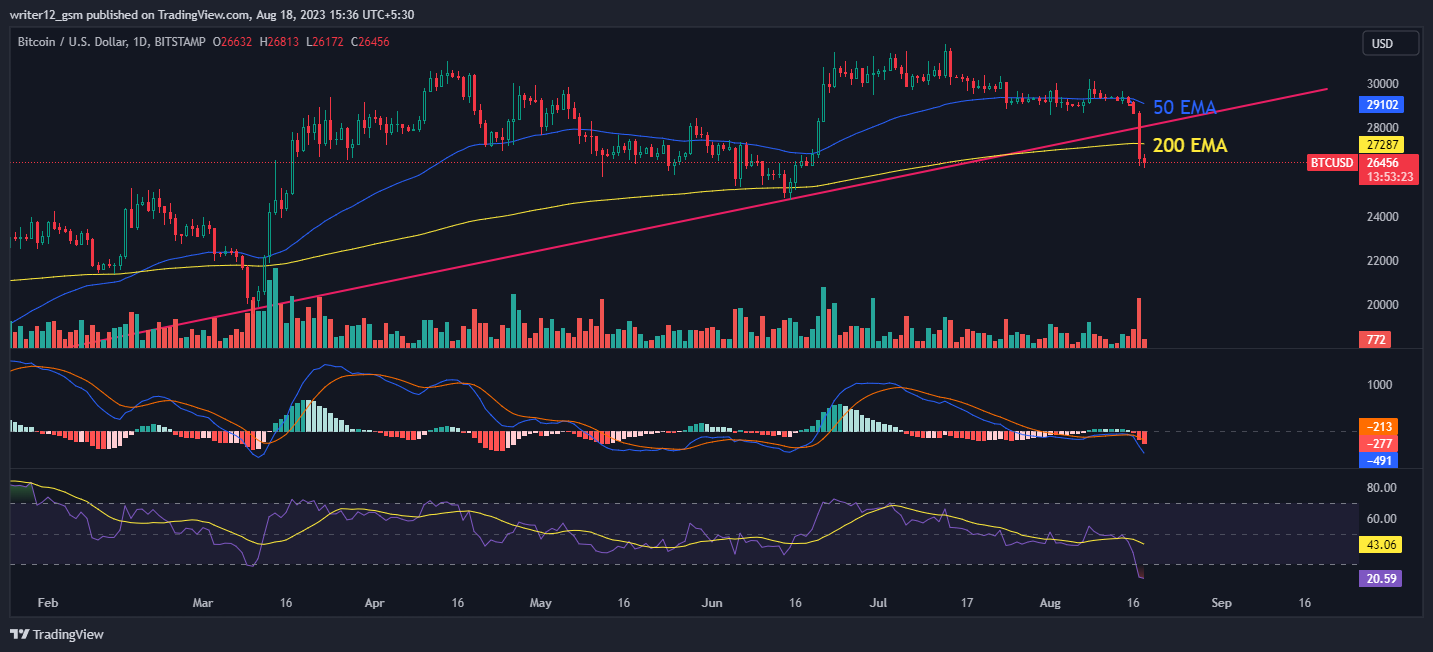
At the time of publishing, Bitcoin crypto (USD: Bitcoin) is trading below the 50 and 200-day simple moving averages, which shows bearish momentum.
Nevertheless, if selling volume adds up, then the price might conquer supporting SMAs by making lower highs and lows. Hence, the Bitcoin price is expected to move downwards giving bearish sentiments over the daily time frame chart.
The current value of RSI is 20.37 points. The 14 SMA is below the median line at 43.05 points which indicates that the Bitcoin is bearish.
The MACD line at -495 and the signal line at -214 are above the zero line. A bearish crossover is observed in the MACD which signals more bearishness for Bitcoin.
Summary
BTCUSD is under bearish pressure after the news of SpaceX’s sale of its BTC holdings. Bitcoin (USD: BTC) technical oscillators also support the bearish trend. The MACD, RSI, and EMA gave negative signs and imply that the downtrend may continue. Bitcoin price action suggests that investors and traders are bearish on the 1-D time frame.
Technical Levels
- Support Levels: Nearest support levels are $25,396 and $23,572.
- Resistance Levels: Nearest resistance levels are $31,085 and $32,940.
Disclaimer
The analysis provided in this article is for informational and educational purposes only. Do not rely on this information as financial, investment, or trading advice. Investing and trading in crypto involves risk. Please assess your situation and risk tolerance before making any investment decisions.

Adarsh Singh is a true connoisseur of Defi and Blockchain technologies, who left his job at a “Big 4” multinational finance firm to pursue crypto and NFT trading full-time. He has a strong background in finance, with MBA from a prestigious B-school. He delves deep into these innovative fields, unraveling their intricacies. Uncovering hidden gems, be it coins, tokens or NFTs, is his expertise. NFTs drive deep interest for him, and his creative analysis of NFTs opens up engaging narratives. He strives to bring decentralized digital assets accessible to the masses.


