
 Home
Home News
News

- 1 Apple’s stock price decreased by 1.60% over the past seven days and 9.64% in the last month.
- 2 At press time, Apple stock price was $174.49 with a rise of 0.28% in the last 24 hours and a market cap of 2.728 Trillion.
- 3 AAPL share price is experiencing strong bearish pressure.
Apple was in a bullish momentum but the flight did not last long as the bears down the price and the share price tanked below the 50 moving average. Afterward, buyers did not hold the momentum and started unwinding their positions resulting in slippages in stock price.

Apple’s (NASDAQ: AAPL) stock price shows bearishness, losing the gains below the major moving averages. Recently, AAPL stock gave a breakdown below the trendline of $187.00.

Moreover, the price action shows that Apple stock has persisted in facing selling pressure, and buyers have stayed on the back foot. In contrast, sellers have a strong edge and continue to make short positions.
However, Apple stock has stayed in a downtrend over the past week and persisted in forming lower lows sequences, taking support from the 200 EMA, which acted as a support for the existing trend.
At press time, AAPL stock was trading at $174.49 with an intraday minor loss of 0.28% breaking below the 50-day EMA, showing bearishness on the charts. Moreover, the intraday trading volume is 61.172 Million, and the average 10 days trading volume is 59.4 Million.
The company had a mixed year so far. Year-to-date it gave positive returns of 33.93% and 14.53% in the span of 6 months. In the last 1 month, it gave a negative return of -9.64% and the last seven days’ return was -1.60%.
If Apple can sustain at this level, the price could continue to rise and reach the first and second targets of $200.92 and $192.39, respectively. However, if it falls below $193.76, it could hit the support levels of $168.83 and $160.1.
Technical Analysis of Apple Stock Price
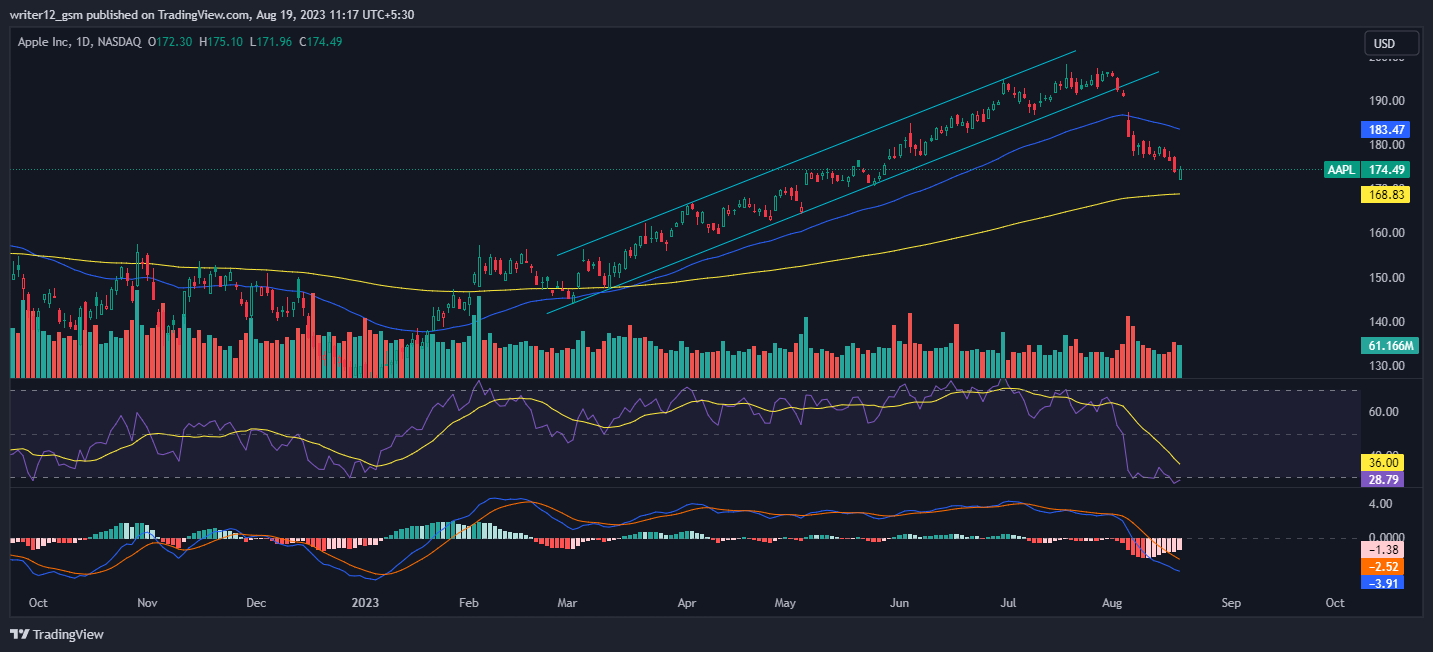
Apple stock is currently trading below the 50-day and heading towards 200-day SMAs, which are providing support to the price trend. However, if selling pressure increases, the price could break below these SMAs and move lower.
The RSI is currently at 28.79, which is in the neutral zone. However, the 14-day SMA is above the MACD line, which is a bearish signal.
The MACD indicator is also bearish, with the MACD line crossing below the signal line. This indicates that Apple stock is likely to continue to fall in the near future.
Overall, the technical indicators suggest that Apple stock is bearish in the short term. However, if it can maintain the $50 level, it could continue to rise in the long term.
Summary
Apple stock’s price action suggests that the investors and traders are bearish on the 1-D time frame. The price action reflects a bearish perspective at the moment. Apple’s (NASDAQ: AAPL) technical oscillators also support the bearish trend. The MACD, RSI, and EMA are emphasizing the negative signs and imply that the downtrend may continue in the AAPL stock price.
Technical Levels
- Support Levels: Nearest support levels are $168.83 and $160.1.
- Resistance Levels: Nearest resistance levels are $200.92 and $192.39.
Disclaimer
The analysis provided in this article is for informational and educational purposes only. Do not rely on this information as financial, investment, or trading advice. Investing and trading in stock involves risk. Please assess your situation and risk tolerance before making any investment decisions.

Andrew is a blockchain developer who developed his interest in cryptocurrencies while pursuing his post-graduation major in blockchain development. He is a keen observer of details and shares his passion for writing, along with coding. His backend knowledge about blockchain helps him give a unique perspective to his writing skills, and a reliable craft at explaining the concepts such as blockchain programming, languages and token minting. He also frequently shares technical details and performance indicators of ICOs and IDOs.


