
 Home
Home News
News
- 1 EQT stock price revamped from the support zone and showed a reversal on the charts.
- 2 Buyers persist in accumulation and are willing to revisit the round spot of $50.
EQT stock price chart shows a rounding bottom formation. It recovered from the demand zone of $28, and started surging inside the rising channel. Moreover, the price action shows buyer accumulation and a positive outlook. EQT stock chart shows a bullish structure and suggests a near-term rise based on the technical structure.
From the start of 2023, EQT stock gained momentum and persisted in the surge. Furthermore, the stock is trading above the significant moving averages and heading to revisit the round spot of $50. EQT stock shows that the price has persisted in forming higher highs, indicating a continuation of the uptrend.

At press time, EQT stock price was $43.47 with an intraday gain of 1.31%, showing bullishness on the charts. Moreover, the trading volume remained at 5.989 Million near average, while the market cap is $15.721 Billion.
Analysts maintained a strong buy and outperform rating with a yearly target price of $47.87, suggesting a growth outlook for the upcoming sessions.
About EQT Corporation
EQT Corp is an independent natural gas production company with operations
focused on the cores of the Marcellus and Utica shales in the Appalachian Basin, located in the Eastern United States.
The firm focuses on executing combo-development projects for developing multiwell pads to meet supply needs, focusing on maximizing operational efficiency, technology, and sustainability. Its main customers include the Appalachian Basin’s marketers, utilities, and industrial operators. The company has one reportable segment, and its revenue stems from three types of gas reserves: natural gas, natural gas liquids, and crude oil.
EQT Stock Close to Breakout Region on Daily Charts
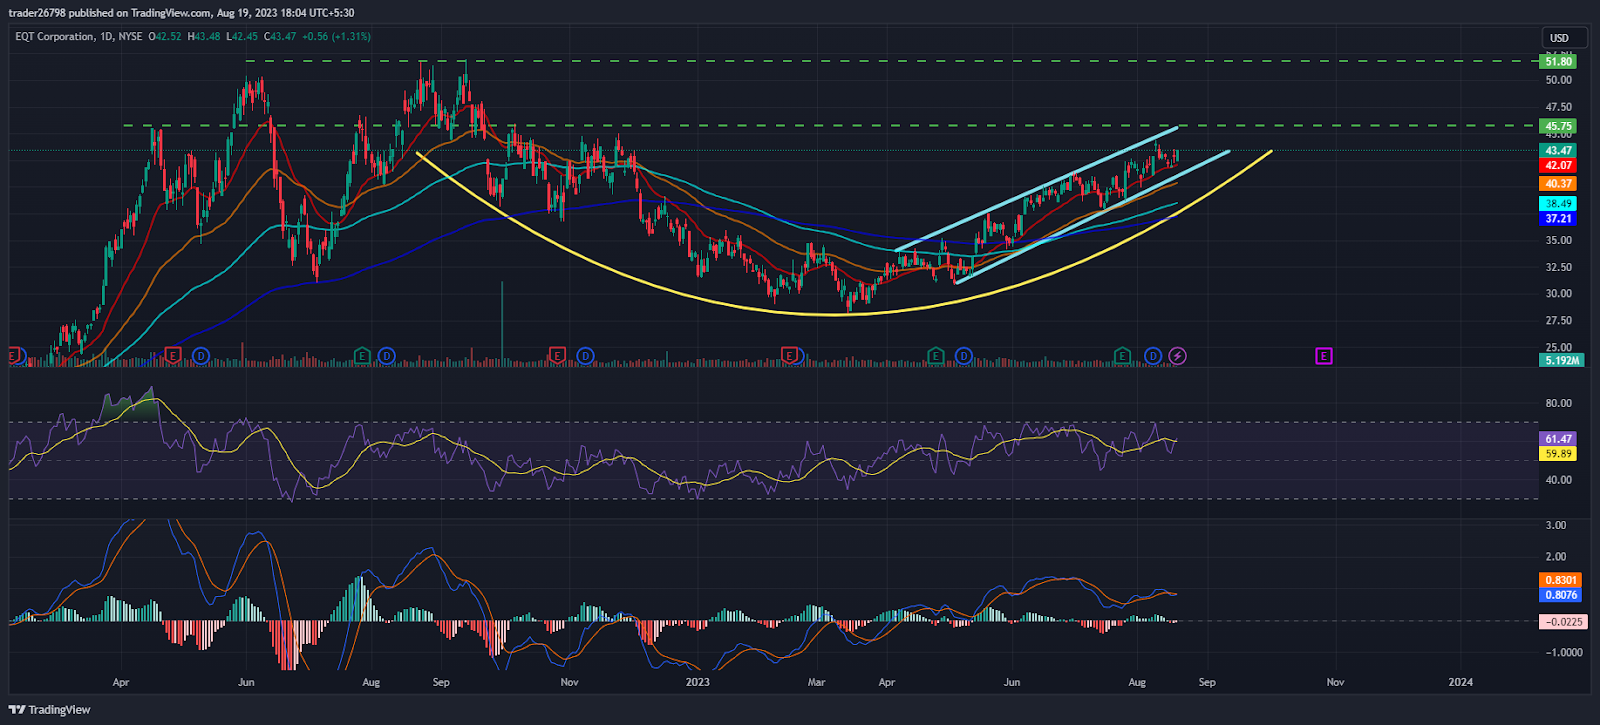
EQT stock price shows buyer dominance, and the price is close to the neckline of the breakout region, near $45, which, if surpassed, leads to a retest of $50.
Moreover, the stock is trading in the bullish territory, while buyers persisted in accumulation and making long positions in the past sessions. As per the Fib levels, EQT stock is trading above neutrality and close to the 61.8% Fib level indicating bullishness on the charts.
Furthermore, the price is near the upper Bollinger band suggesting strong demand for the stock. The RSI curve stayed in the overbought zone and showed bullish divergence indicating a positive outlook on the charts.
The MACD indicator showed a bullish crossover and indicated that the signal line is close to the MA line. However, the indicator suggests that follow-on buying and uptrend continuation could be seen in the upcoming sessions.
Conclusion
EQT stock price has shown a round shaped recovery and persists in gaining inside the rising parallel channel. Moreover, the technical indicators suggest a further rise toward $50. The stock is holding the gains and maintaining the bull territory on the charts.
Technical Levels:
Support Levels: $40 and $35
Resistance Levels: $45 and $50
Disclaimer
The views and opinions stated by the author, or any people named in this article, are for informational purposes only and do not establish financial, investment, or other advice. Investing in or trading crypto assets comes with a risk of financial loss.

Nancy J. Allen is a crypto enthusiast, with a major in macroeconomics and minor in business statistics. She believes that cryptocurrencies inspire people to be their own banks, and step aside from traditional monetary exchange systems. She is also intrigued by blockchain technology and its functioning. She frequently researches, and posts content on the top altcoins, their theoretical working principles and technical price predictions.


