
 Home
Home News
News
- 1 GM stock price is currently trading at $33.12 with a drop of 0.61% in the last 24 hours.
- 2 GM stock shows selling pressure; it is heading toward the demand zone of $31.50.
- 3 Sellers have gained momentum and looked aggressive in the past sessions.
GM stock faced resistance from the $40.70 mark and broke 50, 100, and 200 days EMAs demonstrating bearishness in the stock. General Motors stock has been trading within rectangular channels and consolidating between $41.50 and $31.50. This downfall shows that bears are in control.
General Motors stock has stayed in a downtrend over the past months and persisted in forming lower highs and lower lows sequences, facing rejection from the upper trendline, which acted as a barrier.

Furthermore, the price action shows that GM stock has persisted in facing selling pressure, and buyers have stayed on the back foot. In contrast, sellers have a strong edge and continue to make short positions.
At press time, General Motors stock was trading at $33.12 with an intraday minor gain of 0.61%, breaking below the 50 and 200-day EMAs, showing bearishness on the charts. Moreover, the intraday trading volume (11.78 Million) also showed a decline, as compared to the average 10 days volume of 14.23 Million. The market cap of General Motors stock is $45.57 Billion.
What Technical Indicators Show
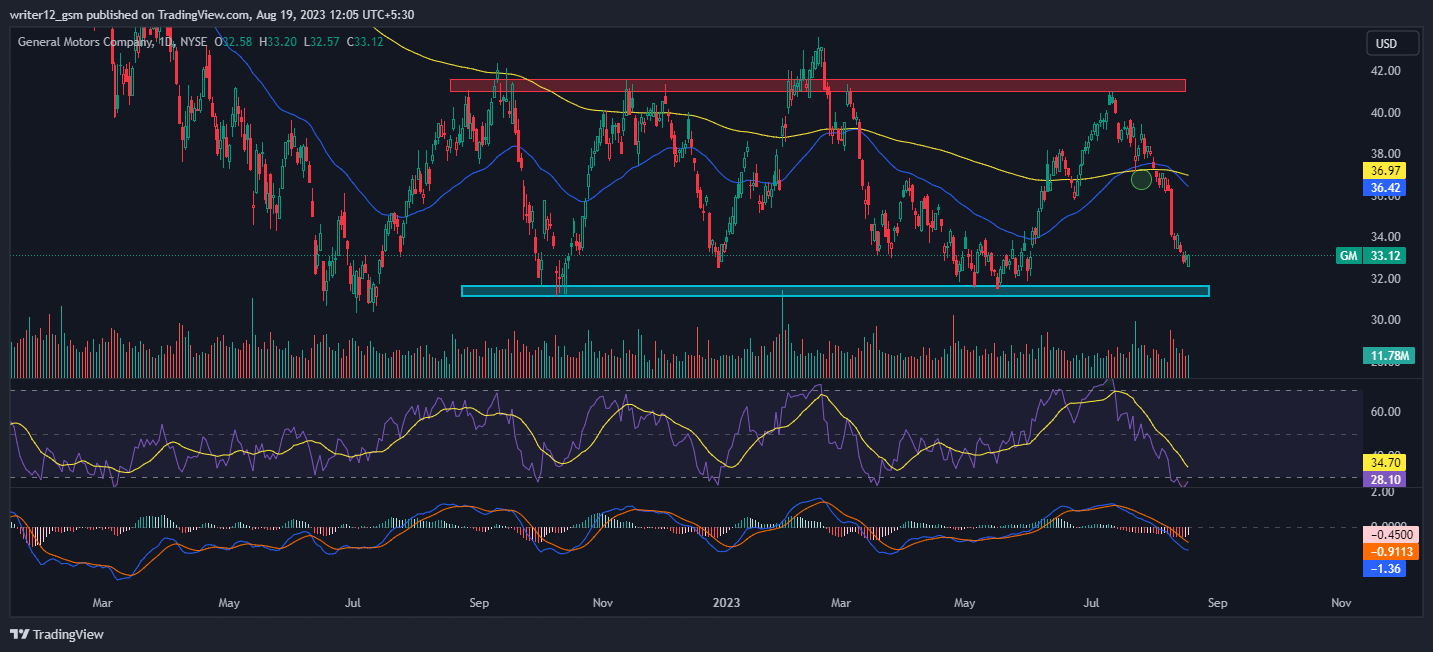
On the daily charts, GM stock shows a pattern in which the price is near the lower trendline below the 50-day SMA, signaling weakness. Recently, the stock was rejected from the upper trendline.
GM stock is now trading near the middle Bollinger band and above the 0% Fib level, below the 23.60% level, near $33. Furthermore, the chart shows sellers are gaining traction and preparing for the next bearish move.
On the daily charts, GM stock is on the verge of a breakdown, which will be registered when the price falls below $31.50. However, buyers are accumulating the stock by defending it from the support of $31.50.
The RSI curve is floating near 28.10 showing a downfall from the neutral zone indicating sellers’ presence in the previous trading sessions.
The MACD indicator shows a bearish momentum and maintains red bars on the histogram, suggesting the bearishness of the stock.
Summary
GM (NYSE: General Motors) technical oscillators indicate a bullish trend. The MACD, RSI, and EMA are giving bearish signs and suggest that the downtrend could continue in the General Motors stock price. GM price action suggests that the investors and traders are bullish on the 1-D time frame. The price action reflects a bullish perspective at the moment. Furthermore, GM Investors might be avoiding the fear of missing out.
Technical Levels
- Support Levels: Nearest support levels are $31.71 and $30.36
- Resistance Levels: Nearest resistance levels are $41.10 and $38.21.
Disclaimer
The analysis provided in this article is for informational and educational purposes only. Do not rely on this information as financial, investment, or trading advice. Investing and trading in stock involves risk. Please assess your situation and risk tolerance before making any investment decisions.

Andrew is a blockchain developer who developed his interest in cryptocurrencies while pursuing his post-graduation major in blockchain development. He is a keen observer of details and shares his passion for writing, along with coding. His backend knowledge about blockchain helps him give a unique perspective to his writing skills, and a reliable craft at explaining the concepts such as blockchain programming, languages and token minting. He also frequently shares technical details and performance indicators of ICOs and IDOs.


