
 Home
Home News
News
- 1 UNI token price has been bearish in the past few trading sessions.
- 2 Bears look aggressive as the price decline persists..
Uniswap price shows the breakdown of the rising channel and selling pressure in the last trading sessions, indicating bearishness on the charts. Moreover, the chart shows the path curve, which suggests that the price will likely retest the demand zone near $3.500 in the upcoming sessions due to the selling pressure and long unwinding shown on the charts.
Furthermore, the price action shows that the UNI token price shows massive red candles with a volume spike, indicating that sellers are active and made short positions during the breakdown, which suggests the corrective phase in the following sessions.

The chart shows that the UNI token broke the rising channel pattern and fell below the significant moving averages, showing a breakdown on charts. Moreover, the technicals suggest further selloff to retest the demand zone near $3.500. However, the price is close to the support range, where buyers paused and looked for a rebound.
At press time, the UNI token price is trading at $4.942 with an intraday gain of 0.71%, showing a doji candlestick which nullified the selling pressure. Moreover, the trading volume increased by 3.51% to $89.38 Million, and the pair of UNI/BTC is at 0.000190 BTC. The market cap of UNI token is $4.18 Billion.
However, the trajectory of the UNI token shows that the price has shown a breakdown, with a bounce that retested the zone near $5.20. Furthermore, the chart structure indicates a short buildup, showing seller interest increased in the last sessions.
UNI Price Action on Daily Charts
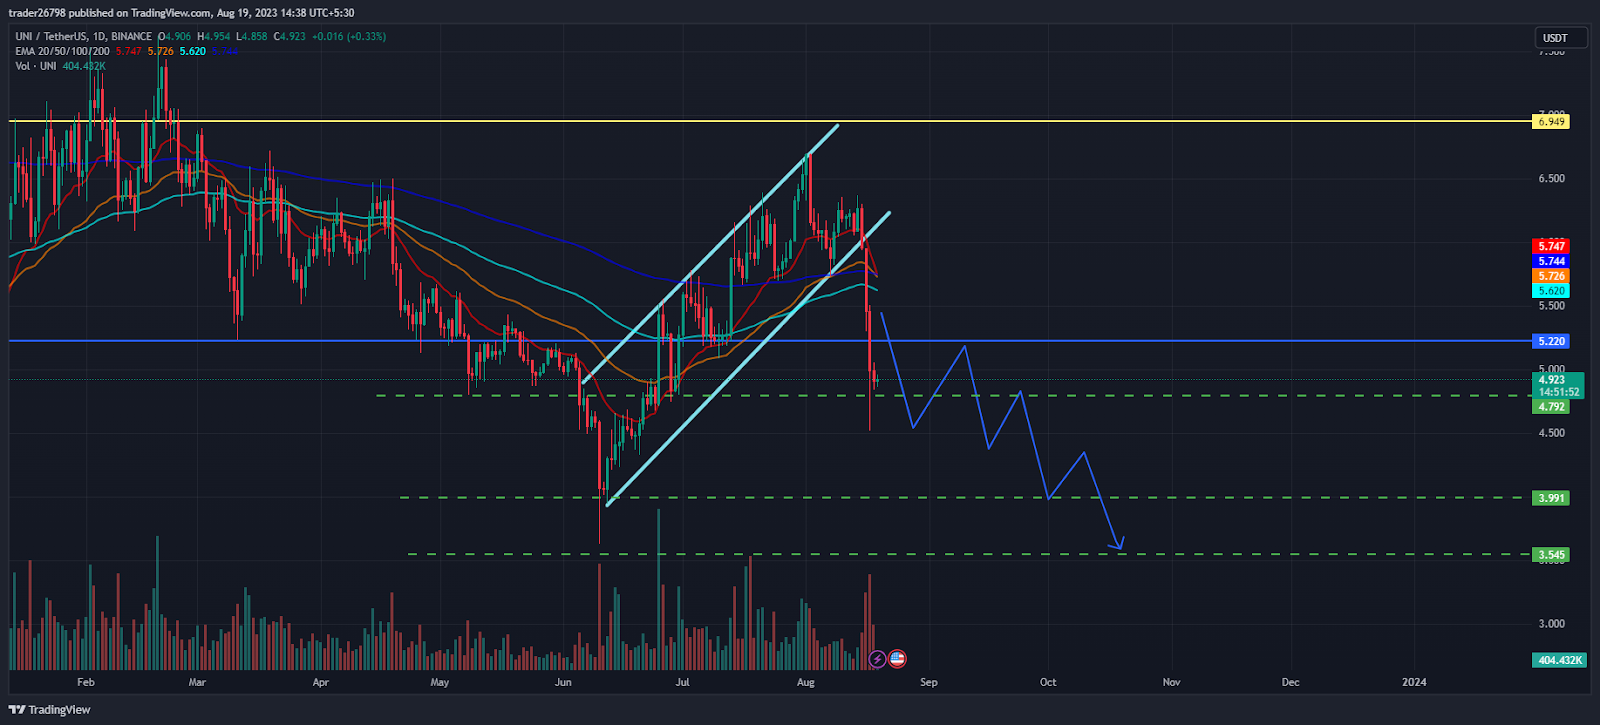
On the daily charts, the UNI token price showed a breakdown and suggested follow-on selling for the next session, as shown by the path curve. Moreover, the chart shows seller dominance and indicates a negative outlook.
As per the Fib levels, the UNI token price slipped below neutrality toward the 38.2% level, near $4.90, which if broken, will lead to a massive fall toward the 23.6% level near $4.00. Moreover, the price trades near the lower Bollinger band and shows a bearish structure.
What Technical Indicators Show?
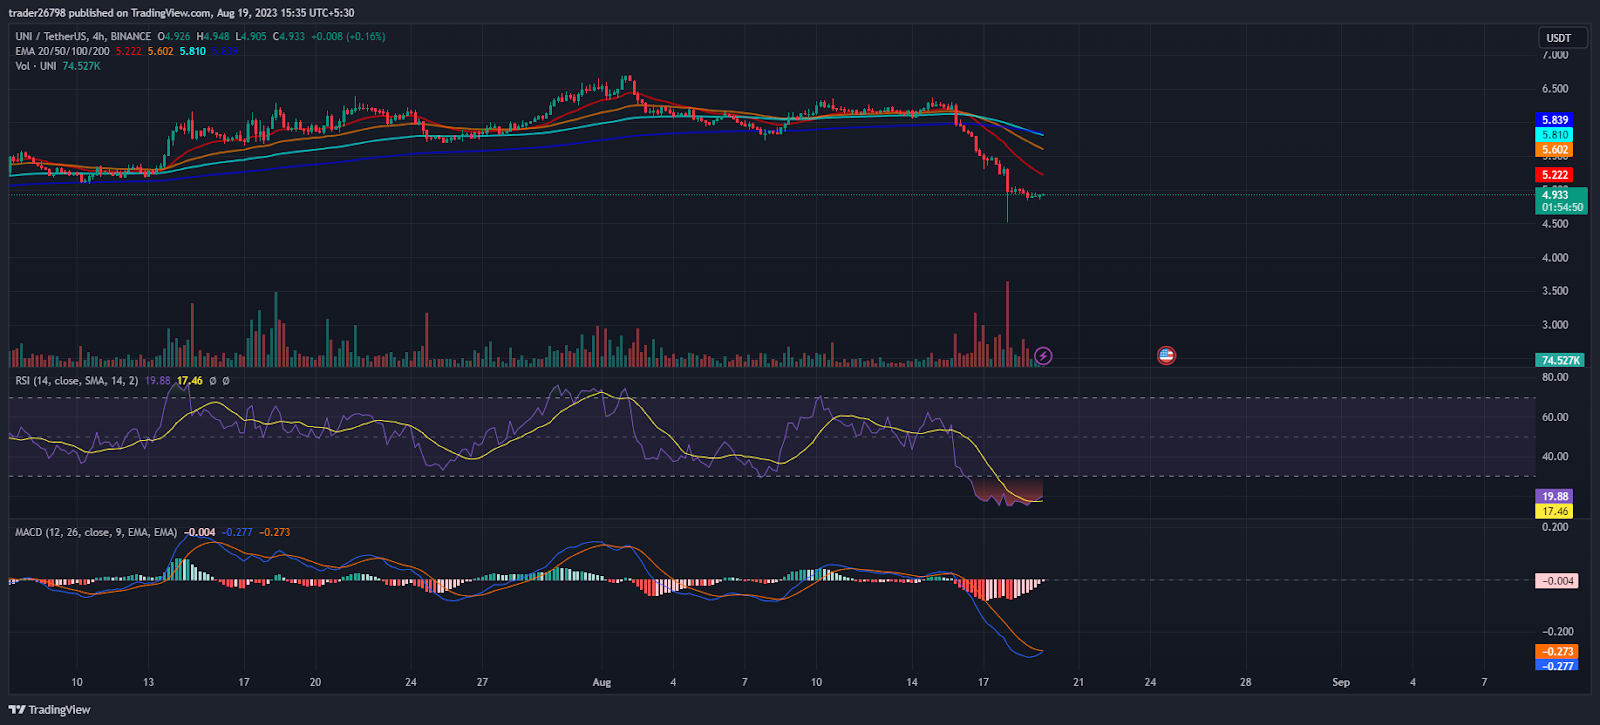
On the 4-hour charts, Uniswap price has shown a massive fall and broke the cluster & round mark of $5.00, indicating aggressive selling in the last session.
The RSI curve shows a sharp fall toward the oversold region. A bearish divergence on the charts indicates a negative outlook on the charts.
The MACD indicator showed a bearish crossover and formed red bars on the histogram, suggesting sellers’ attainability.
Conclusion
Uniswap token price shows a channel breakdown and indicates seller dominance on the charts. Moreover, the trajectory shows that UNI will retest the demand zone at $4.00. Furthermore, the price action suggests that selling pressure persisted and indicated a negative outlook for the upcoming sessions.
Technical Levels
Support Levels: $4.50 and $4.00
Resistance Levels:$5.20 and $6.00
Disclaimer
The views and opinions stated by the author, or any people named in this article, are for informational purposes only and do not establish financial, investment, or other advice. Investing in or trading crypto assets comes with a risk of financial loss.

Nancy J. Allen is a crypto enthusiast, with a major in macroeconomics and minor in business statistics. She believes that cryptocurrencies inspire people to be their own banks, and step aside from traditional monetary exchange systems. She is also intrigued by blockchain technology and its functioning. She frequently researches, and posts content on the top altcoins, their theoretical working principles and technical price predictions.


