
 Home
Home News
News

- 1 XRP price is trading close to the demand zone near $0.450.
- 2 Buyers are accumulating and attempting a bounce to rescue the gains.
Ripple (XRP) price shows a breakdown of the falling wedge pattern and lost around 15% of gains last week. Moreover, the XRP price slipped below the 200-day EMA, showing selling pressure in the past sessions. However, candlestick with a rejection wick was noted while retesting the demand zone, which indicates that buyers have maintained their grip near $0.4500. XRP price predicts a buy-on-dip scenario and signals a healthy accumulation in the upcoming sessions by the mighty bulls.

XRP price action indicates that the price has re-entered the congestion zone, and the seller succeeds in their mission of pushing from the supply range. Moreover, the Ripple price shows massive seller volume, indicating short buildup activity on the charts. Buyers were cautious and in trouble due to the breakdown that happened in the previous week.

XRP price is trading close to the 200-day EMA, which acts as a barrier indicating that sellers have maintained strong resilience. However, the price faced resistance after bouncing off the demand zone signaling that price may face consolidation in the following sessions due to the volume uptick, which may lead to narrow range moves below the 100-day EMA.
At press time, XRP price is trading at $0.5252 with an intraday gain of 1.12%, showing the intention of bulls to surpass the 200-day EMA. Moreover, the trading volume increased by 3.80% to $1.16 Billion, and the pair of XRP/BTC is at 0.0000203 BTC. However, the market cap of XRP is $28.10 Billion, and analysts maintained a sell rating suggesting underperformance in the following sessions.
XRP Price Action On Daily Charts Indicates Selling Pressure

XRP price has captured the supply region in the past few days but showed strong rejection, resulting in the retracement and price re-entering of the congestion zone. Moreover, the price slipped below the 38.2% Fib level and showed fresh selling in the past sessions. Furthermore, the technical indicators signaled bearishness on the charts.
Short Term Charts Indicates a Bounce
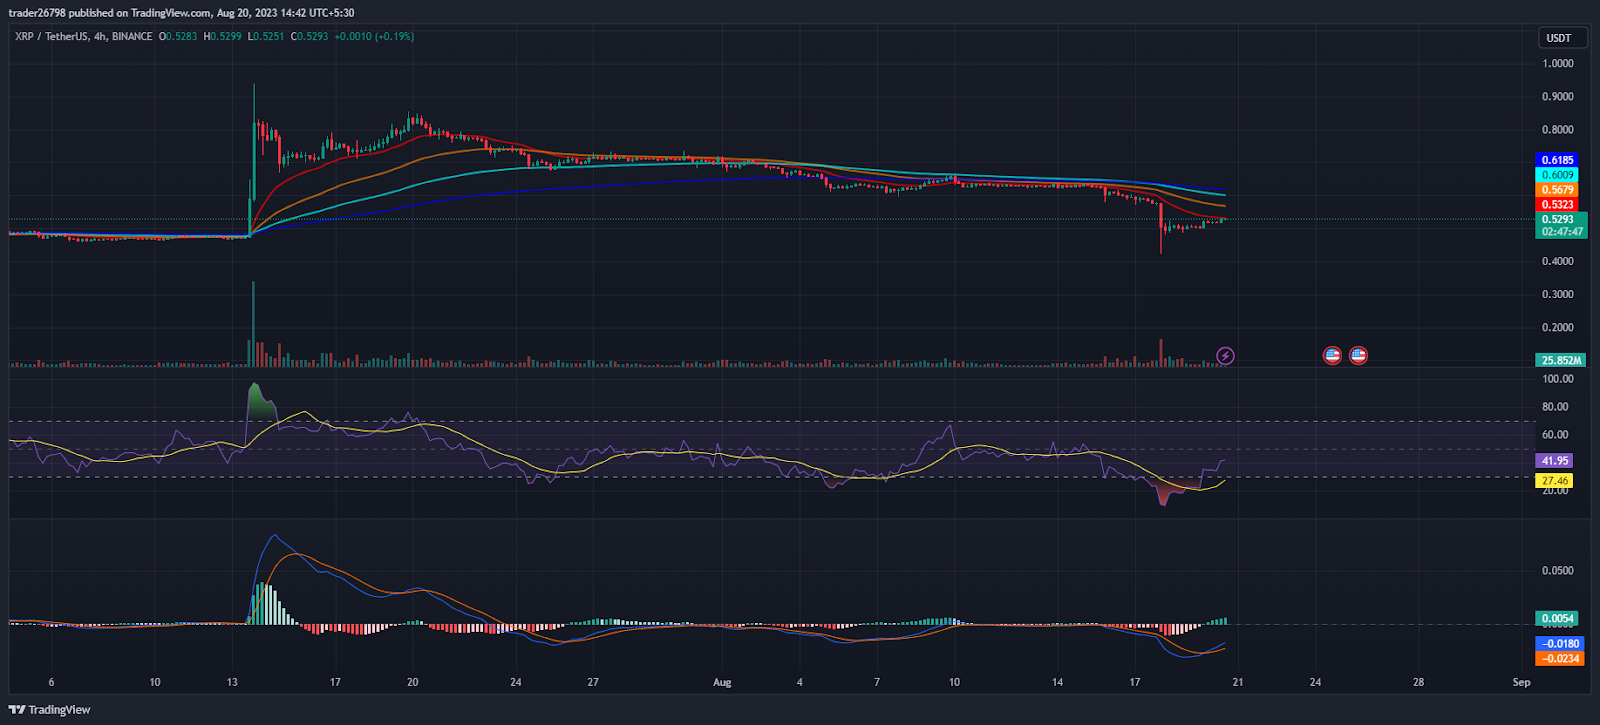
On the 4-hour charts, the XRP price has shown a bounce, indicating buyers’ accumulation and highlighted an attempt to rescue the gains amid the selling pressure in the past sessions. However, the price is near the 200-day EMA, a solid range to escape, and might be challenging for the bulls.
The RSI curve bounced from the oversold region and noted a positive crossover, indicating that the price will likely retest the 100-day EMA.
The MACD indicator showed a bullish crossover and noted the green bars on the histogram, suggesting buyer accumulation on the charts.
Conclusion
XRP price has shown selling pressure and is hovering near the 200-day EMA which indicates seller dominance in the past sessions. Moreover, the price lost the initial gains and re-entered the congestion zone, showing that buyers have lost strength and started unwinding their positions.
Technical Levels:
Support Levels: $0.450 and $0.400
Resistance Levels: $0.550 and $0.600
Disclaimer
The views and opinions stated by the author, or any people named in this article, are for informational purposes only and do not establish financial, investment, or other advice. Investing in or trading crypto assets comes with a risk of financial loss.

Adarsh Singh is a true connoisseur of Defi and Blockchain technologies, who left his job at a “Big 4” multinational finance firm to pursue crypto and NFT trading full-time. He has a strong background in finance, with MBA from a prestigious B-school. He delves deep into these innovative fields, unraveling their intricacies. Uncovering hidden gems, be it coins, tokens or NFTs, is his expertise. NFTs drive deep interest for him, and his creative analysis of NFTs opens up engaging narratives. He strives to bring decentralized digital assets accessible to the masses.


