


Optimism’s price recently declined after breaking down an upward parallel channel, indicating a change in its price trajectory. Currently, efforts are being made to initiate a reversal from its present position. The success of this reversal largely depends on the capacity of the OP cryptocurrency to attract buyers, thereby facilitating a recovery back within the bounds of the channel.
However, this journey back seems to be quite challenging, given the difficulties Optimism is facing in establishing a strong upward momentum. While traders and investors closely observe this situation, the crypto community remains vigilant for indications of a potential resurgence, which could serve as a significant turning point for the price trend of Optimism.
Optimism price was at $1.509 and has gained 2.44% of its market capitalization intraday. Trading volume increased around 29.79% during the intraday trading session. This demonstrates that buyers are trying to push OP crypto back inside an ascending parallel channel. The volume-to-market cap ratio was 9.08%.
Is Optimism Price Ready to Mark its Comeback?
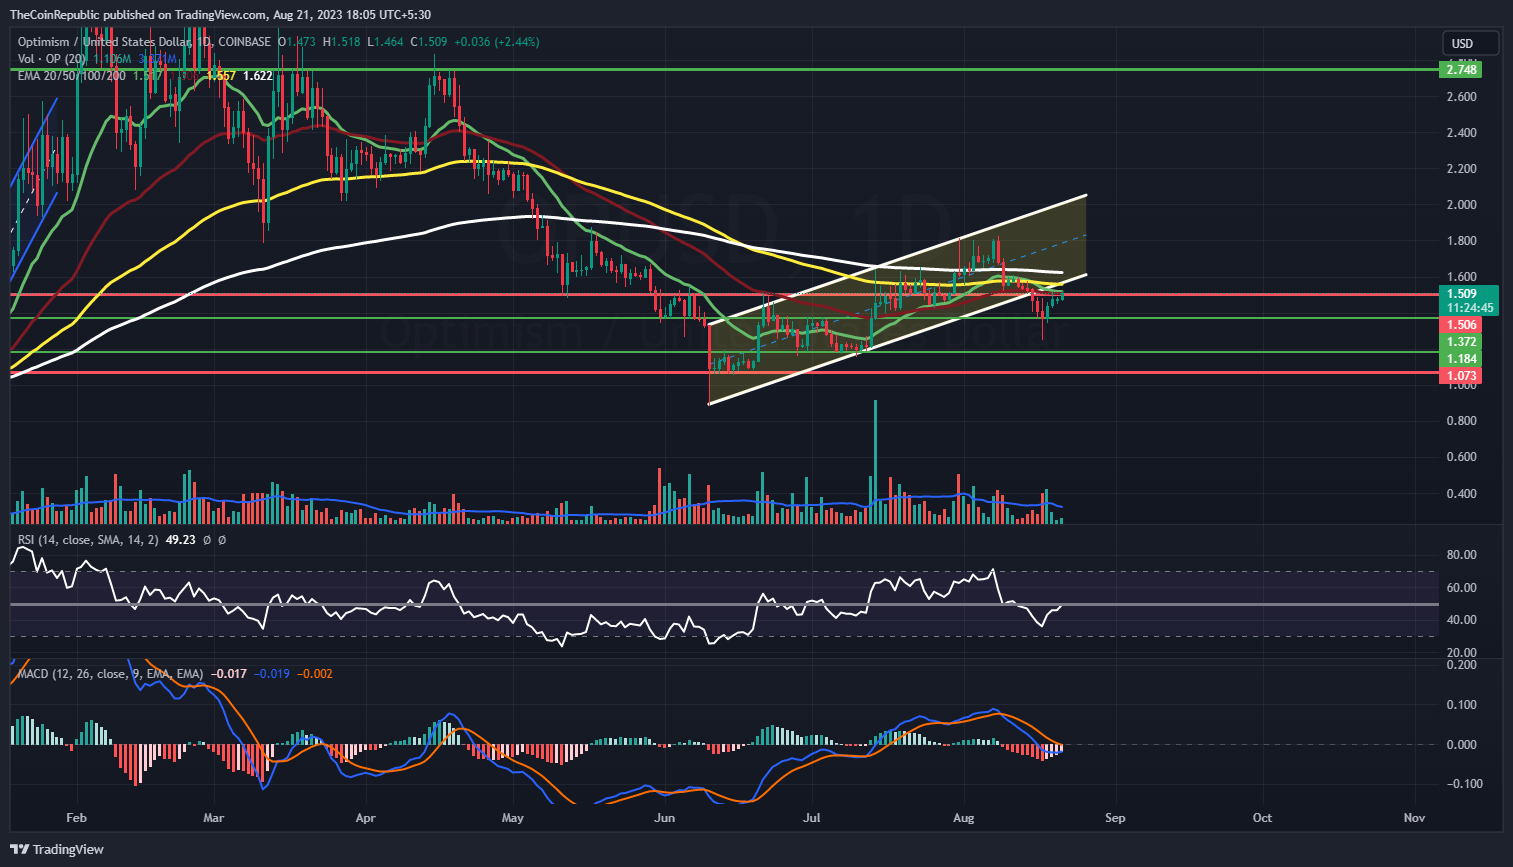
Starting from August 12th, Optimism price has been in a downward trend, breaking out of the declining parallel channel illustrated on the daily chart. To re-enter that channel, the OP cryptocurrency requires a greater presence of buyers.
To achieve this goal, an increase in the rate at which buyers are accumulating is essential, as this would steer OP back toward its path of recovery. The need for this uptick in buyer activity is underscored by the fact that trading volume has been below average.
Within the span of a week, Optimism’s price has fallen by approximately 1.69%, yet it managed to gain 0.20% over the course of a month. Over the past three months, OP crypto experienced a decline of around 7.47%, and in the preceding six months, it dropped by about 40.13%. Despite these fluctuations, it’s important to highlight that Optimism crypto has achieved a recovery of approximately 64.78% year-to-date.
Technical indicators are indicating a positive trend in the price of Optimism. The Relative Strength Index (RSI) points toward an upward trend in OP crypto. Additionally, the moving average convergence divergence (MACD) underscores the upward trajectory in the price of OP cryptocurrency.
The RSI was situated at 49 and is on the verge of departing from neutrality. The MACD line has moved beneath the signal line due to a negative crossover; however, it is nearing the signal line for a potential positive crossover. Investors involved with Optimism crypto should exercise patience and wait for any shift in direction on the daily time frame chart.
Summary
Optimism’s price recently declined after breaking down an upward parallel channel, indicating a change in its price trajectory. To achieve this goal, an increase in the rate at which buyers are accumulating is essential, as this would steer OP back toward its path of recovery. Technical indicators are indicating a positive trend in the price of Optimism.
Technical Levels
Support Levels: $1.45 and $1.372
Resistance Levels: $1.53 and $1.60


