
 Home
Home News
News
- 1 XDC Network’s price (XDC) is down by 3.09% in the last 24 hours to trade at $0.0512 at the time of writing.
- 2 XDC’s price (XDC) hiked nearly 150% from the recent swing low, currently, declining.
XDC Network’s price has turned out to be multi-bagger crypto for short-term investors as the price surged 102.27% in the past 6 months and bagged a return of 74.2% in the past 3 months to their investors.
The price surged after a long consolidation near the swing low thus shifting the long-term trend to uptrend.

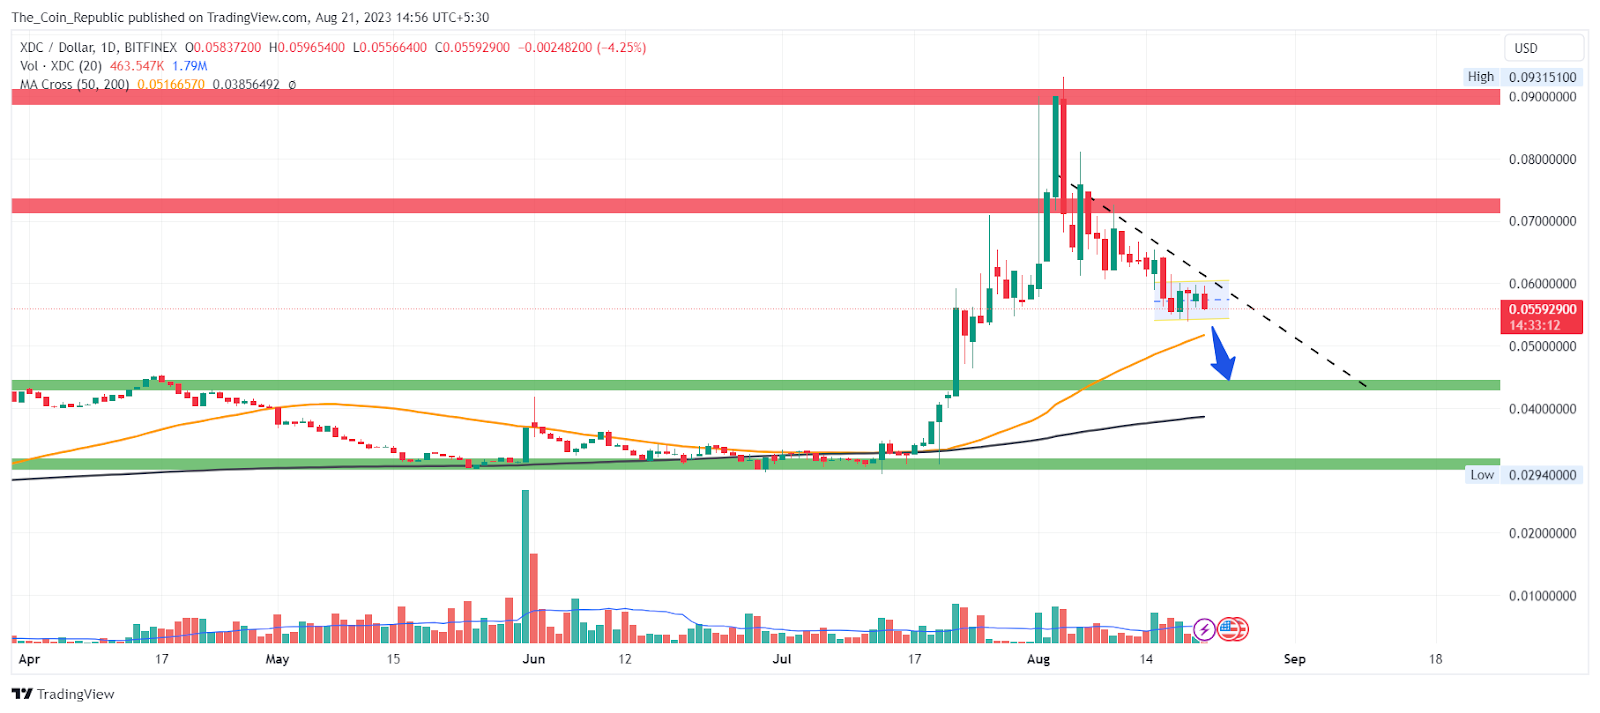
However, the short-term gain initiated a profit booking and the price declined after testing the upper supply level. Currently, the price is declining suffering resistance from an upper trendline on the daily chart.
XDC Network (XDC) is a layer 1 blockchain that works with the ISO 20022 payment standard and the EVM. It allows developers and financial institutions to build applications on it. The XDCPay app is a web extension that supports some browsers and makes it easier for investors and businesses to use the XDC Network.
XDC Network Price Experiences Strong Selling From The Upper Levels
The XDC Network price currently trades at $0.0512 with a decline of 3.09% in the past 24 hours.
The Analysts predict that the price may continue to decline in the short term until it finds strong support from the lower levels. Also, the price has made a trending move it might be taking a pullback and preparing for further movement.
The long-term outlook for the price trend still stands on the positive side and the short-term decline may turn out to be a pullback in the long term.
Technical Indicators signal the continuation of the Ongoing Trend
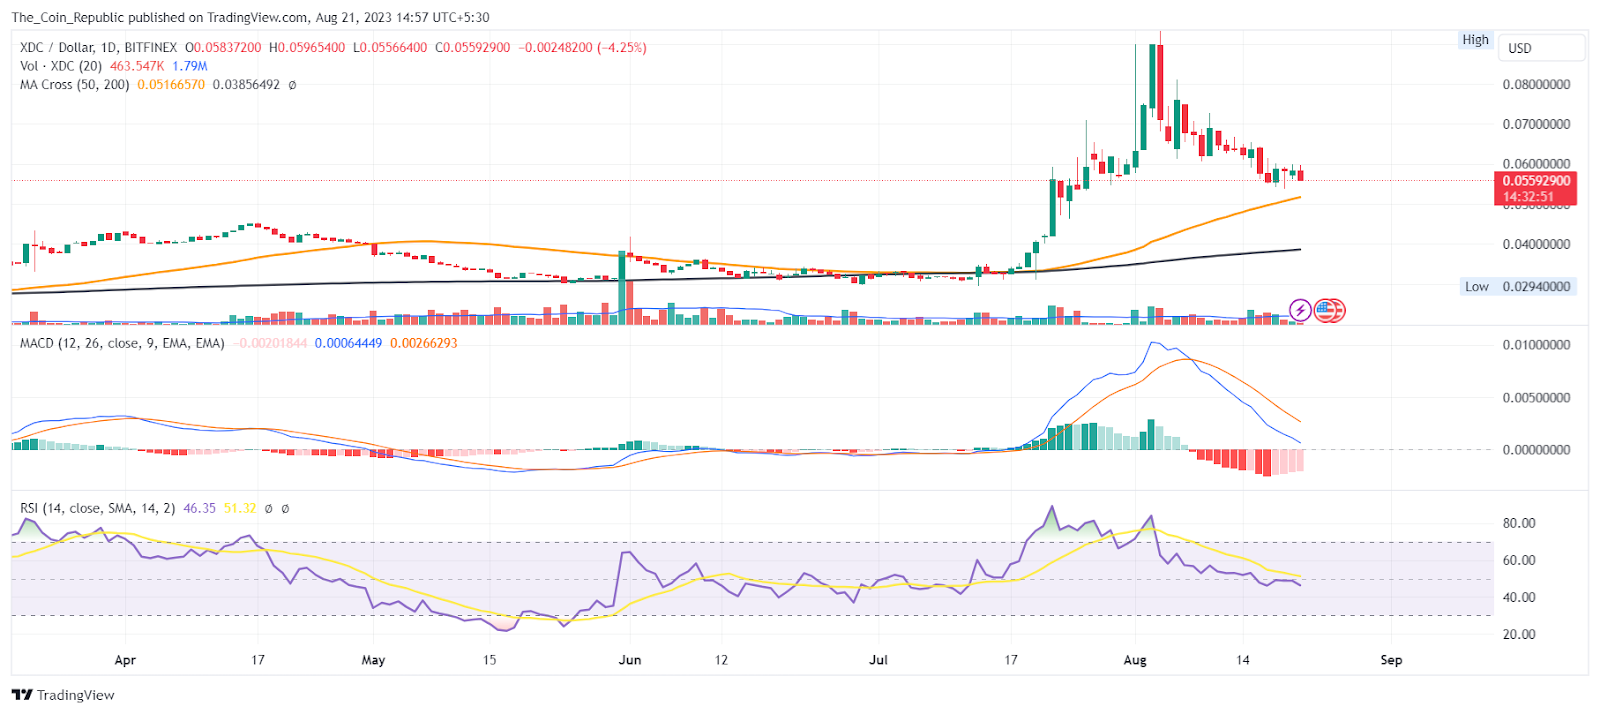
As per the EMA analysis, the XDC price is trading above both the 50 and 200 EMA indicating a strong uptrend prevailed in the market. The EMAs may act as a support to the declining price.
MACD lines have shown a bearish crossover. Also, Histogram bars are being formed below the mean line and of increasing height indicating the bearish sentiment in the market which may continue to prevail until the price gets the buyer’s support.
Conclusion
XDC Network price (XDC) rose 102.27% in six months and 74.2% in three months, ending the consolidation and starting an uptrend. However, it faced profit booking and resistance from an upper trendline and fell to $0.0512, down 3.09% in 24 hours. Analysts expect the price to decline further until it finds support from lower levels. The price may be pulling back for the next move. The long-term outlook is still positive and the short-term decline may be a correction.
Technical Levels
- Support levels: $0.043 and $0.032.
- Resistance levels: $0.073 and $0.091.
Disclaimer
The views and opinions stated by the author, or any people named in this article, are for informational purposes only and do not establish financial, investment, or other advice. Investing in or trading crypto or stock comes with a risk of financial loss.

Nancy J. Allen is a crypto enthusiast, with a major in macroeconomics and minor in business statistics. She believes that cryptocurrencies inspire people to be their own banks, and step aside from traditional monetary exchange systems. She is also intrigued by blockchain technology and its functioning. She frequently researches, and posts content on the top altcoins, their theoretical working principles and technical price predictions.


