
 Home
Home News
News

- 1 Apple stock is trying to sustain, CMP is $175.84, and traits are spotted for an upcoming move and might reverse.
- 2 AAPL stock price decreased by 1.20% over the past week and the current volume is below average.
- 3 Apple Inc. ( NASDAQ: AAPL) stock’s 52-week price range is around $124 – $198, and trading below major EMA’s.
Apple stock recently publicized its Q2 earning report on August 3rd, 2023, the reported earnings gave a positive surprise by 81.72% from the estimated earnings. Moreover, the reported revenue also gave a positive surprise of 2.084 Million from the estimated revenue. Apple stock prices are trading low since August 4th Friday. The stock trend has fallen sharply below after reporting the stock’s second-quarter earnings.

Apple has a debt-to-equity ratio of 181.3%, as reported by Simply Wall St. This implies that Apple has more debt ($109.28 Billion) than equity ($60.29 Billion), which is the difference between Apple’s total assets of $335.04 Billion and total liabilities of $274.76 Billion.

Apple experienced an incline in its earnings at a rate of 14.8% per year on average, according to Simply Wall St., a financial website. The Tech industry’s average annual earnings growth is 7.5%. Therefore, Apple’s earnings are higher twice the industry average.
Moreover, Apple Inc. (AAPL) stock market capitalization is $2.749 Trillion and the total revenue is $394.328 Billion. The stock’s basic EPS is $5.98 and the price-to-earnings ratio is 29.32.
Technical Analysis of Apple Stock Price in 1-D Timeframe
The price action shows that Apple Inc. ( NASDAQ: AAPL) stock price was in a swift uptrend from May 24th, and reached a high of around $197 since then the Apple stock declined as resistance was at an all-time high level and is in a downtrend from August 1st by making lower lows and highs.
At the time of publication, Apple stock’s current price is trading around the demand zone of $175.84 trying to sustain CMP and might be showing reversal traits in Apple Inc. ( NASDAQ: AAPL) stock. Furthermore Stock’s waiting to be triggered over a daily time frame chart over the demand zone, either the AAPL Stock price might take support and ascend upwards from the demand zone as liquidity is present or conversely, crash further after consuming liquidity.
Therefore, if Apple fails to sustain the current level, the AAPL price could continue to drag downwards and hit the nearest support levels around $170.59 and $165.37.
However, if the stock price sustains the current level and the Apple price increases, then it might reach the nearest resistance levels of $182.75 and $187.25.
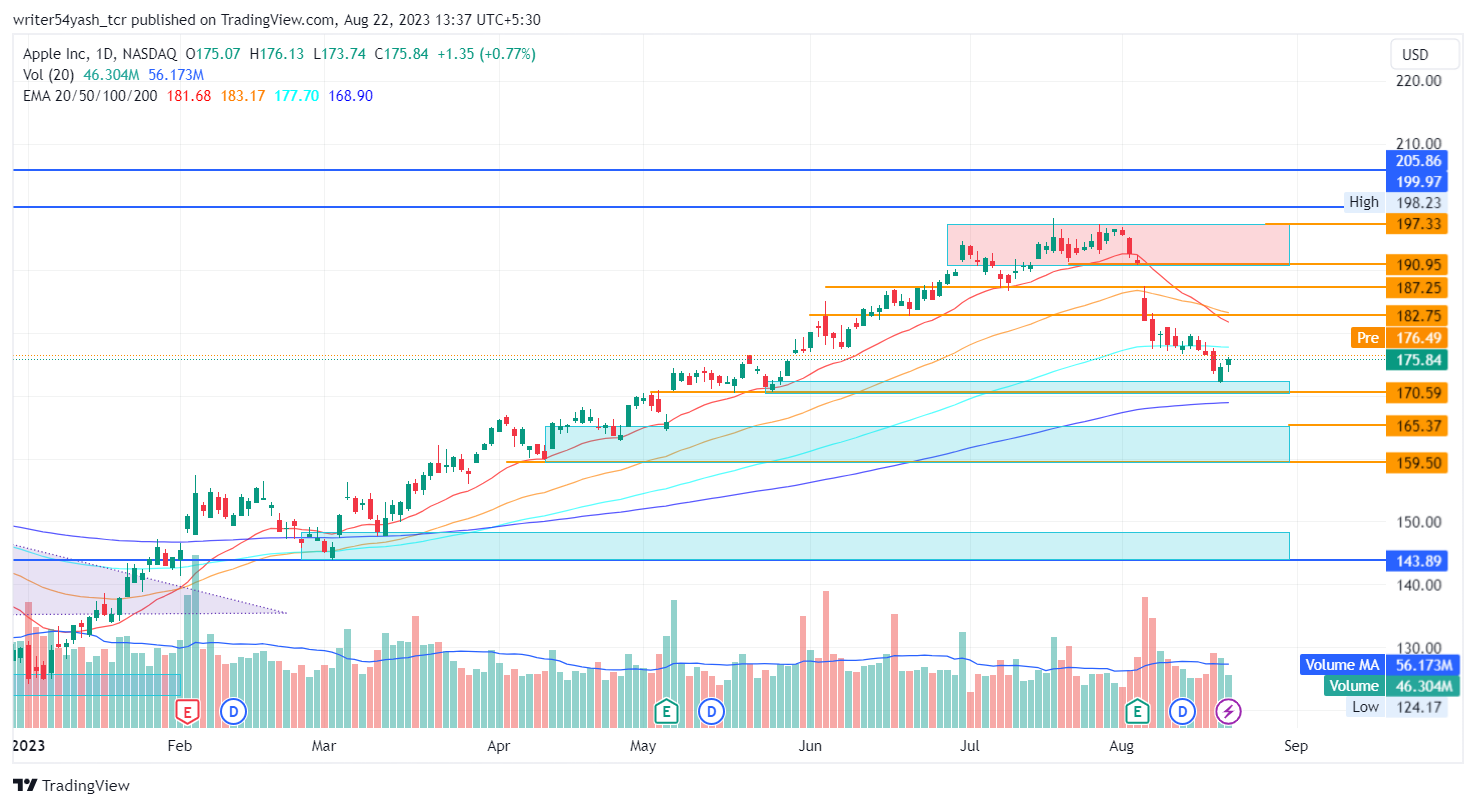
At the time of publishing, Apple Inc. (NASDAQ: AAPL) is trading below the exponential moving average (EMA – 20, 50, and 100-day), which declines the Apple price (AAPL) trend.
However, the 200-day exponential moving average (EMA) is supporting the trend if more buying volume ascends then the price might conquer rejecting 20, 50, and 100-day EMA by making higher highs and lows.
Alternatively, if more selling volume rises in Apple stock then the price might capture in-between support and 200-day EMA by making lower highs and lows.
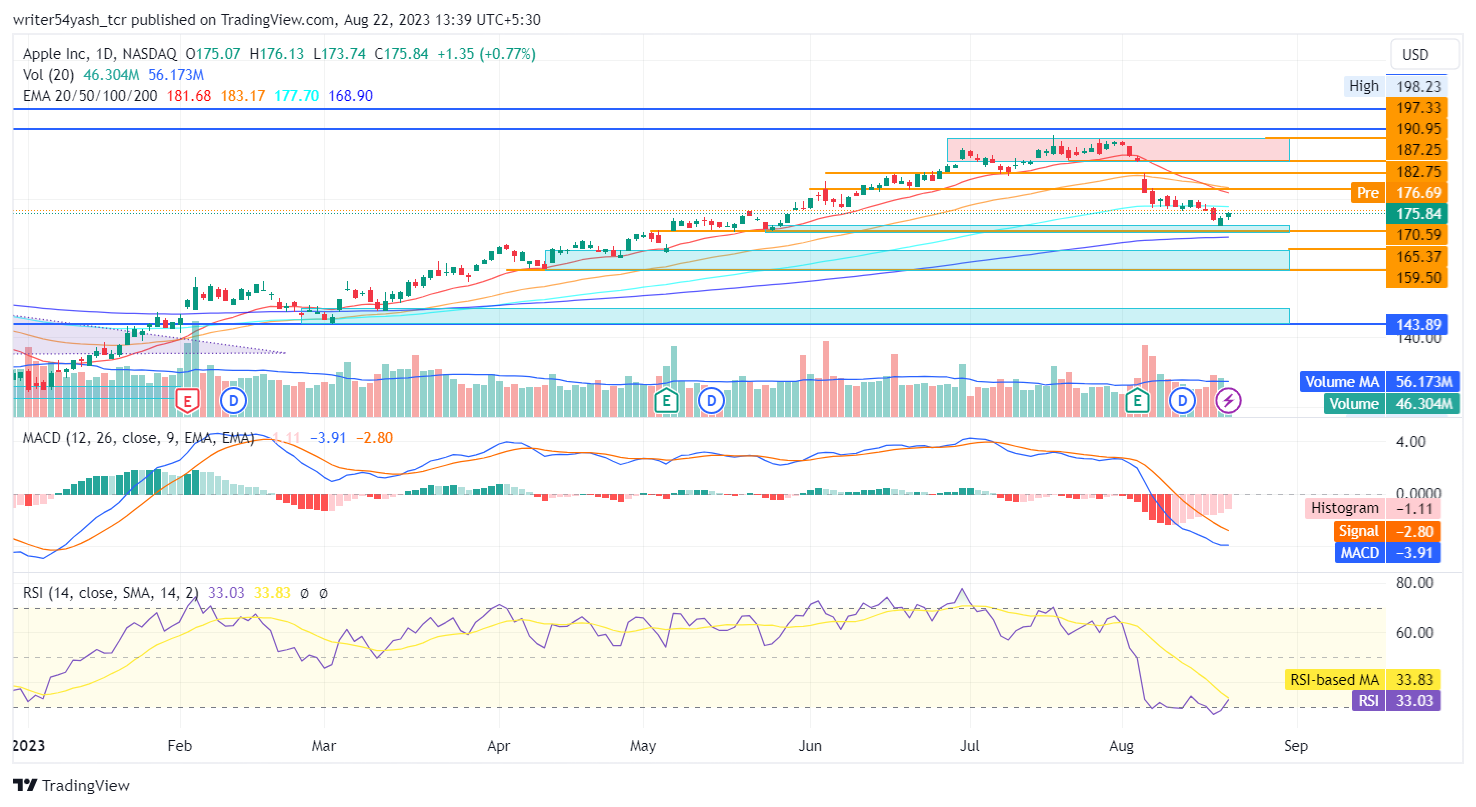
The current value of RSI is 33.03 points. The 14 SMA is below the median line at 33.83 points which indicates that Apple stock is in bearish territory.
The MACD line at 3.91 and signal line at 2.80 are below the zero line and both lines have crossed each other. A bearish crossover is noticed in the MACD oscillator which expresses bearishness as the histogram gap is large for the Apple stock price.
Summary
Apple Inc. (NASDAQ: AAPL) stock price action highlights bearish views at the time of publishing. The stock also highlights that the investors and traders of the Apple stock price are pessimistic over the daily time frame(1-D). The technical analysis tools EMA, RSI, and MACD mostly sought and reliable oscillators for Apple stock price also support bearishness and highlight downward signals in AAPL stock price.
Technical Levels
- Support levels: The nearest support levels for Apple stock price are $170.59 and $165.37.
- Resistance levels: The nearest resistance levels for the AAPL stock price are $182.75 and $187.25.
Disclaimer
In this article, the views and opinions stated by the author, or any people named are for informational purposes only, and they don’t establish the investment, financial, or any other advice. Trading or investing in cryptocurrency assets comes with a risk of financial loss.

Andrew is a blockchain developer who developed his interest in cryptocurrencies while pursuing his post-graduation major in blockchain development. He is a keen observer of details and shares his passion for writing, along with coding. His backend knowledge about blockchain helps him give a unique perspective to his writing skills, and a reliable craft at explaining the concepts such as blockchain programming, languages and token minting. He also frequently shares technical details and performance indicators of ICOs and IDOs.


