
 Home
Home News
News

- 1 At press time, the BTC price was $26077 with a drop of -0.18% in the last 24 hours.
- 2 The market cap of BTC was $507.577 Billion.
- 3 Bitcoin’s crypto price declined by -11.32% over the last seven days.
Bitcoin price projection reveals that the BTC holders’ beliefs are on the downside. Bitcoin needs additional positive momentum in order to bounce back from the existing level. Nevertheless, sellers may approach 50-SMA which is acting as a hurdle to the BTC price.

The Bitcoin price projection indicates the coin reversed the downturn from the level of $31000. The crypto is struggling to move beyond 50 and 200-day exponential moving averages.

Bitcoin investor sentiments are bearish. Investors may prefer to keep a keen eye on crypto. Presently, the BTC price is below the key EMAs and MA levels. At present, BTC is trading near the value of $26077.
It has a market capitalization of around $506.724 Billion with a fully diluted market cap of $546.714 Billion with a circulating supply of 19.465 Million.
Technicals indicate selling pressure while the technical oscillators indicate bearishness. The moving averages are also on the bearish side. This highlights bearish dominance in the market.
BTC has taken a break after performing well so far this year. Since the beginning of the year, BTC gave excellent returns of 57.50%. On the other hand, the returns over the past 6 months have been 7.63%.
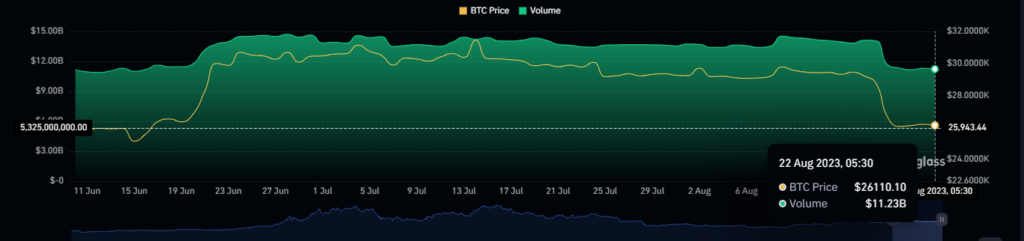
BTC experienced a huge decline in its value and volume. On 15 August 2023, BTC volume was $13.83 Billion at the price of $29437.30 which declined to $11.23 Billion at the price of $26110 On 20 August 2023.
BTC Futures Open Interest (USD) also faced a sudden decline. On August 16, 2023, the open interest was $14.12 Billion which dropped, and on August 22, 2023, it is $11.23 Billion at the price of $26110.
What Does the Technical Analysis Say About Bitcoin?
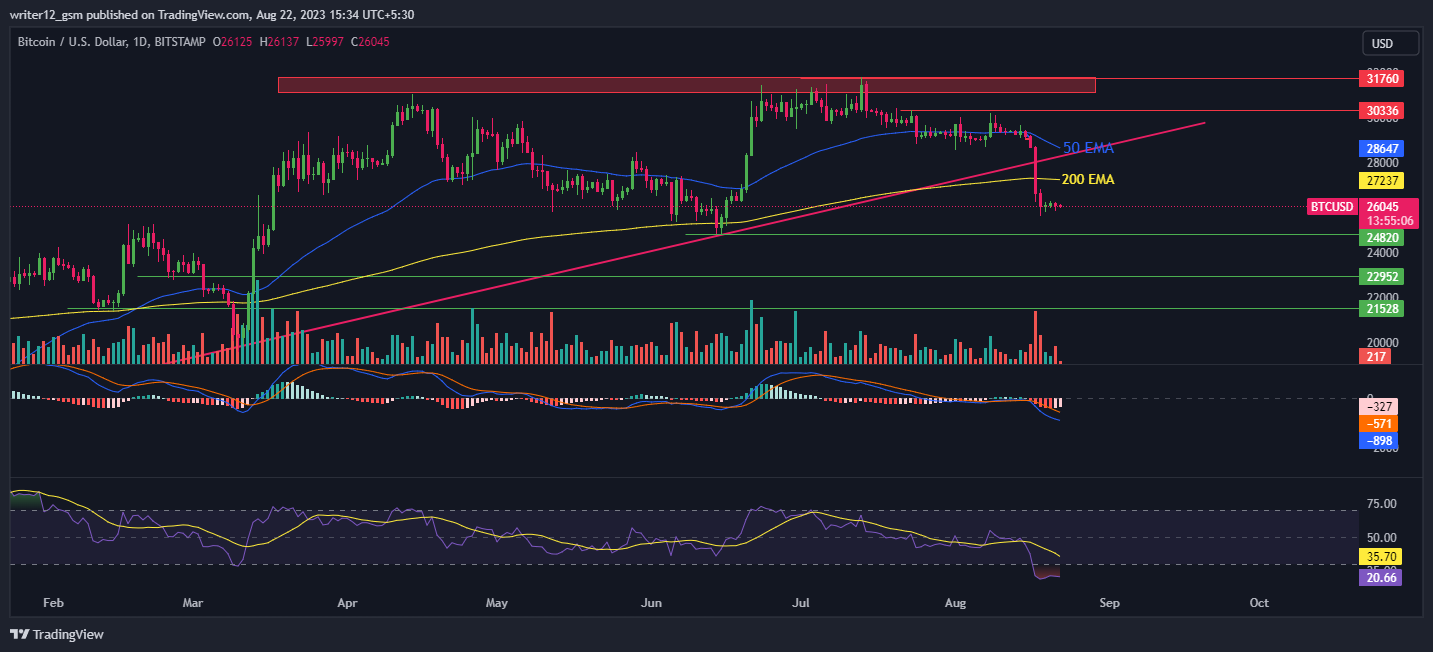
At the moment, Bitcoin is trading underneath the 50 and 200-day exponential moving averages, which shows strong bearish momentum in the BTC. However, if more selling volume adds ups in the crypto, then the price might conquer supporting SMAs by making lower highs and lows.
Thus, the Bitcoin price is anticipated to push downwards showing bearish beliefs over the daily time frame chart.
The current value of RSI is 20.70 points. The 14 SMA is below the median line at 35.70 points which indicates that Bitcoin is bearish. The MACD line at -897 and the signal line at -571 are under the zero line. A bearish crossover is observed in the MACD which signals more bearishness for Bitcoin.
Conclusion
BTC is under bearish pressure after the news of SpaceX’s sale of its BTC holdings. Bitcoin (BTC) technical oscillators also support the bearish trend. The MACD, RSI, and EMA gave negative signs and imply that the downtrend may continue. Bitcoin price action suggests that investors and traders are bearish on the 1-D time frame.
Technical Levels
- Support Levels: $24820 and $22500
- Resistance Levels: $30336 and $31760
Disclaimer
The analysis provided in this article is for informational and educational purposes only. Do not rely on this information as financial, investment, or trading advice. Investing and trading in crypto involves risk. Please assess your situation and risk tolerance before making any investment decisions.

With a background in journalism, Ritika Sharma has worked with many reputed media firms focusing on general news such as politics and crime. She joined The Coin Republic as a reporter for crypto, and found a great passion for cryptocurrency, Web3, NFTs and other digital assets. She spends a lot of time researching and delving deeper into these concepts around the clock, and is a strong advocate for women in STEM.


