
 Home
Home News
News
- 1 PEPE price (PEPE) declined 0.54% in the last 24 hours and is currently trading at $0.00000108.
- 2 Pepe price (PEPE) is consolidating forming an interesting pattern and getting ready for a trending move.
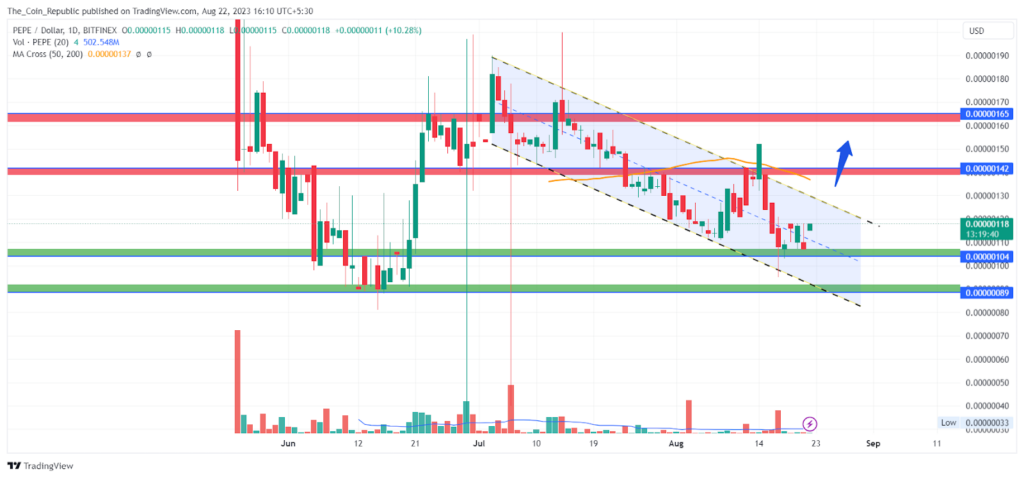
Pepe (PEPE) price surged nearly 80% in June 2023 after bottoming out and making a breakout to the upside thus shifting its long-term trend to an uptrend. Thereafter, the selling pressure from upper levels halted the momentum, and the price topped out followed by a decline.
The price then declined by forming several lower highs and lower lows which led to the formation of a bullish flag pattern.

Recently, the price tried a breakout to the channel pattern but could not get enough buying volume to make a breakout and the price declined to the lower levels.
Pepe (PEPE) is a meme coin on Ethereum that pays homage to Pepe, the Frog meme, created by Matt Furie, which became viral in the early 2000s. The project leverages the fame of meme coins, like Shiba Inu and Dogecoin, and aims to be one of the top meme-based cryptocurrencies.
Pepe Price Trying To Sustain Above the Previous Swing Low
The Pepe price prediction for the short term indicates that the price may remain in a bearish trend and might decline more until it remains in the channel pattern.
However, the breakout of the channel pattern may lead to a shift in the short-term trend and the price may surge higher. It requires more buying volume to accumulate at the lower levels and surge the prices higher.
The volume analysis states that the PEPE token has a trading volume of $66.24 Million with an incline of 40.94% over the past 24 hours. It has over 391.9 Trillion tokens in circulating supply. The volume-to-market cap ratio of the Pepe token is 15.5% indicating mild to high volatility in the market.
Technical Indicators Sentiment About The Price Trend
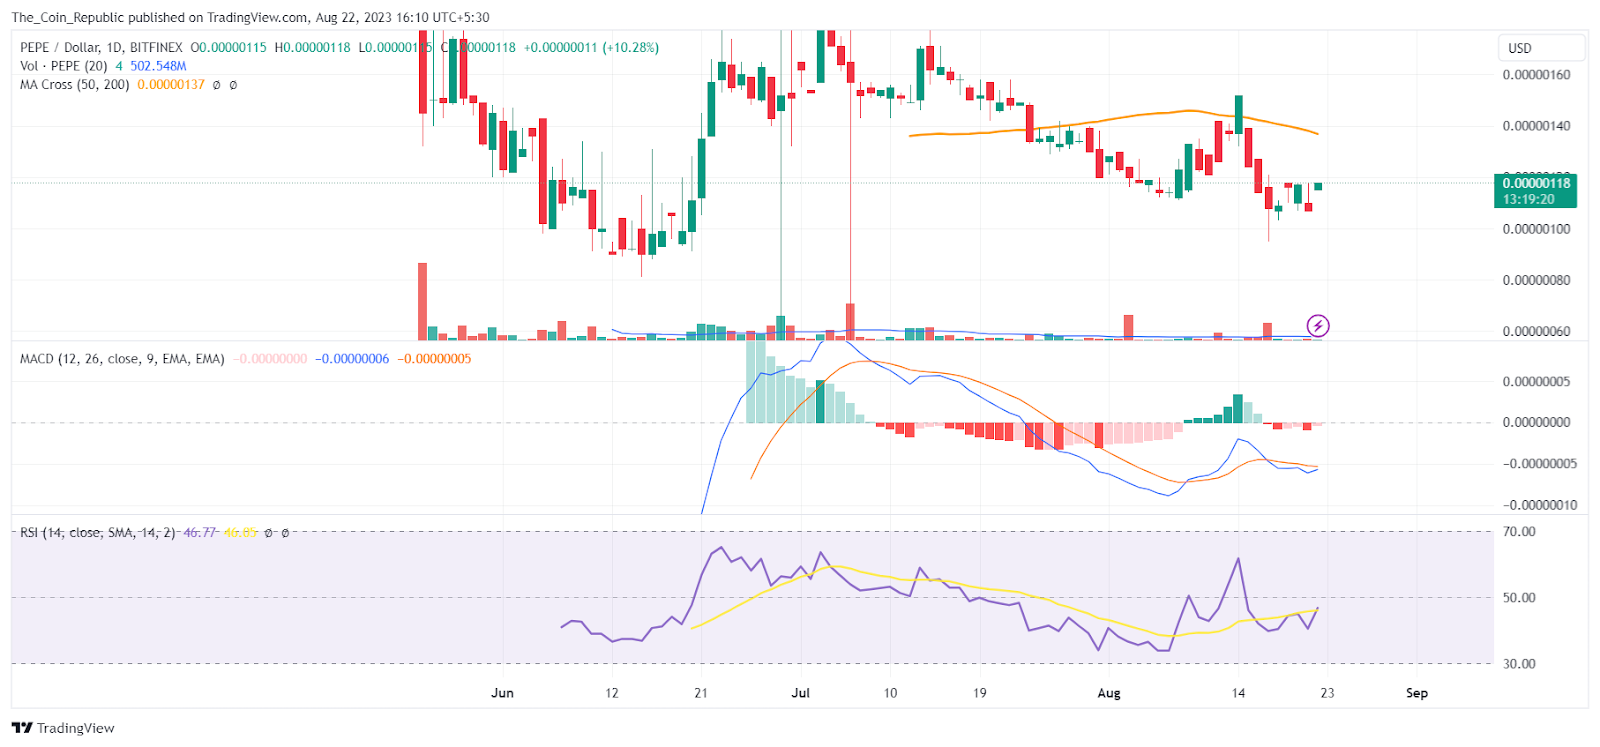
The EMA analysis of the price trend states that the price is trading below the 50 EMA indicating a short-term bearishness in the price trend. The price needs to surpass the hurdles of 50 and 200 to surge higher.
At the time of publishing, the RSI value of the Pepe token is 46.7 and that of the SMA line is 46.05. RSI is signaling a neutral sentiment in the market at the moment.
Conclusion
Pepe price prediction concludes that the price surged 80% in June 2023, but then fell and formed a bullish flag pattern. Recently, the price failed to break out of the channel and may continue to drop. A breakout above the channel could change the trend and push the price higher. However, it requires more buyers to support the rally. The volume analysis shows that Pepe has a high trading volume and volatility. The technical indicators shows a mixed signal about the current price trend.
Technical Levels
- Support levels: $0.00000104 and $0.00000089.
- Resistance levels: $0.00000142 and $0.00000165.
Disclaimer
The views and opinions stated by the author, or any people named in this article, are for informational purposes only and do not establish financial, investment, or other advice. Investing in or trading crypto or stock comes with a risk of financial loss.

Adarsh Singh is a true connoisseur of Defi and Blockchain technologies, who left his job at a “Big 4” multinational finance firm to pursue crypto and NFT trading full-time. He has a strong background in finance, with MBA from a prestigious B-school. He delves deep into these innovative fields, unraveling their intricacies. Uncovering hidden gems, be it coins, tokens or NFTs, is his expertise. NFTs drive deep interest for him, and his creative analysis of NFTs opens up engaging narratives. He strives to bring decentralized digital assets accessible to the masses.


