
 Home
Home News
News
- 1 Roblox stock price (NYSE: RBLX) fell 31% approx in the current month.
- 2 RBLX stock might test a 52-week low in the coming few sessions.
- 3 Roblox Corp. disappointed the investors in quarterly earnings.
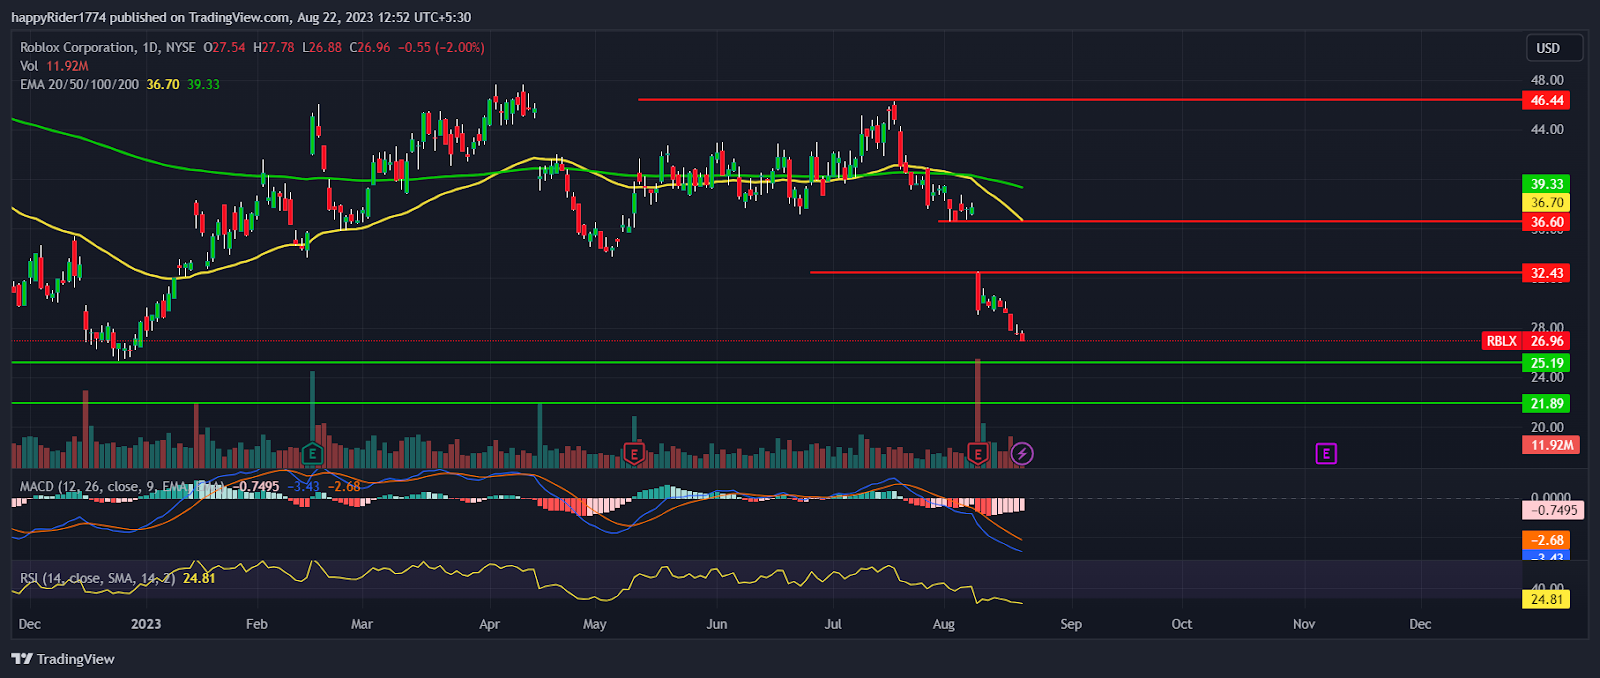
Roblox Stock price (NYSE: RBLX) tumbled 31% in the current month and the sell-off is still going on. The majority of the damage in RBLX stock occurred after the release of quarterly earnings.
RBLX stock price broke down the $36.00 support with a massive gap which created a panic sell-off. Later, prices continued the decline by forming lower lows and reached the lowest level of the year 2023.
In the past few months, Roblox’s stock price consolidated in the range of $36.00 to $46.00. It showed signs of base formation.
Buyers attempted to break the $46.00 hurdle to expand the range upward. But sadly it faced rejection and prices again reverted down.
Roblox Corp. released its quarterly earnings on Aug 9, 2023. It reported an EPS of -0.46 and revenue of $780.7 Million. The company failed to meet the EPS estimate by 5.32% and the revenue estimate by 0.55%.
The earnings figures were near to the analyst estimates but despite that the stock prices reacted negatively. The downfall was massive and it eroded the majority portion of its previous gains.
Will Roblox Stock reverse upward from 52-Week Low?
Roblox stock price (NYSE: RBLX) entered the correction phase and no signs of recovery are visible.
The broader market indices are reversing down which is also negatively impacting the sentiment of investors. If the S&P 500 index declines further then the probability of a bounce back in RBLX shares will decrease.
Till the Roblox stock trades below $33.00 the prices are expected to remain in the bears’ grip. Any short-term bounce will face difficulty to hold the higher levels. The technical analysis suggests RBLX stock is in a downtrend and the possibility of reversal is low.
Is more downside possible in RBLX stock?
RBLX stock fell for 6 consecutive weeks and formed a bearish pattern. If the sell-off continues and prices drop below the $25.00 support the more downside will open.
The MACD curve generates a negative crossover and slips below the zero line.
The histogram bar is declining which confirms the strength of bears.
The super trend generated a sell signal which also indicates bearishness. The RSI at 24 entered into the oversold territory due to which temporary pullback is possible.
Conclusion
Roblox stock price (NYSE: RBLX) fell miserably in August and quarterly earnings fueled the downfall. The technical analysis suggests RBLX stock is inside the bear grip and the possibility of recovery in the next month remains low.
Technical levels
- Resistance levels: $32.00 and $36.00
- Support levels: $25.00 and $22.00
Disclaimer
The views and opinions stated by the author, or any people named in this article, are for informational purposes only. They do not establish financial, investment, or other advice. Investing in or trading crypto assets comes with a risk of financial loss.

Adarsh Singh is a true connoisseur of Defi and Blockchain technologies, who left his job at a “Big 4” multinational finance firm to pursue crypto and NFT trading full-time. He has a strong background in finance, with MBA from a prestigious B-school. He delves deep into these innovative fields, unraveling their intricacies. Uncovering hidden gems, be it coins, tokens or NFTs, is his expertise. NFTs drive deep interest for him, and his creative analysis of NFTs opens up engaging narratives. He strives to bring decentralized digital assets accessible to the masses.


