
 Home
Home News
News

- 1 Ford stock price slid 0.84% in the last trading session and is currently trading at $11.87.
- 2 Ford’s share (NYSE: F) has declined nearly 20% in the past 40 days and heading towards a major support zone which may halt the free fall.
Ford’s stock price bottomed out in May 2023 followed by a breakout that pumped the price to gain nearly 25% in just one month turning the long-term trend to uptrend.
However, the short-term gain in the Ford stock price triggered a sell-off after the double-top formation at the top of the trend and the gap-down opening added fuel to decline in the price. Thereafter, the price declined nearly 20% wiping out all the gains after the previous breakout.

The quarterly results came out to be better than the expectations of wall street which also could not halt the price decline. The Ford company reported 44.95 Billion as revenue, 1.78 Billion more than expectations and the earnings were reported to be 32.65% better than the estimates.
Ford Motor Company (NYSE: F) is a global leader in producing and selling cars, trucks, SUVs, EVs, and Lincoln luxury vehicles. It also offers financial services through its subsidiary, Ford Motor Credit Company LLC.
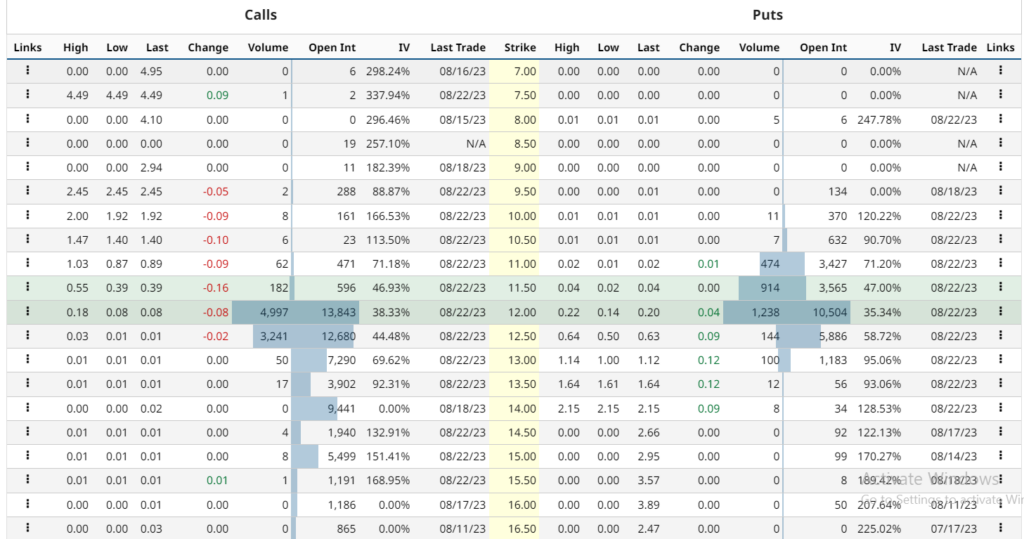
Ford stock derivatives data analysis states that the current implied volatility in the market is 35.1% with an increment of 1.51% in the last trading session. The at-the-money strike price has 3,565 open contracts on the put side and 596 open contracts on the call side indicating the dominance of buyers at the current level. The PUT/CALL ratio is 1.08 indicating a neutral sentiment in the market as per the data.
Ford Stock Price Showed A Free Fall After Topping Out On Daily Chart

The short-term outlook of the analysts indicates that the price might decline some more sessions to reach its previous support zone from where it may get the buyer’s support and halt the free fall. The price may consolidate or surge higher from the demand zone depending upon the strength of buyers in the demand zone.
The price has turned its long-term trend to positive but could not sustain at the upper levels.
Technical Indicators prediction about the current trend

The technical indicators including RSI and MACD opinion rating for the stock is a 40% sell with an average short-term outlook on maintaining the current trend. The market is approaching oversold territory.
Conclusion
Ford’s stock price prediction concludes that the stock price hiked before the quarterly results. However, the short-term gain triggered a sell-off to decline the price by nearly 24% in the past 4 weeks. The price is near a support level that could attract buyers. Analysts are optimistic about the long-term trend of the stock, as the demand for EVs is growing. The put/call ratio is neutral, indicating a balanced market sentiment. The stock has the potential to recover and resume its uptrend.
Technical Levels
- Support levels: $11.25 and $10.63.
- Resistance levels: $13.07 and $13.77.
Disclaimer
The views and opinions stated by the author, or any people named in this article, are for informational purposes only and do not establish financial, investment, or other advice. Investing in or trading crypto or stock comes with a risk of financial loss.
Steve Anderson is an Australian crypto enthusiast. He is a specialist in management and trading for over 5 years. Steve has worked as a crypto trader, he loves learning about decentralisation, understanding the true potential of the blockchain.


