
 Home
Home News
News
- 1 At press time, HOOD stock price was $10.38 with a drop of 0.10% in the last 24 hours.
- 2 HOOD stock shows selling pressure. It is heading below the demand zone of $10.
- 3 Sellers have gained momentum and looked aggressive in the past sessions.
HOOD stock trading in a bearish momentum and bouncing back from a lower trendline. The stock has shown its intent to flip the ongoing trend and break the crucial range of 50 the 200-day EMA.
However, this downfall shows that bears are in control. At press time, Robinhood stock price was $10.38 with an intraday minor loss of -0.10% trading below the major EMAs, showing bearishness on the charts. Moreover, the intraday trading volume of HOOD is 6.452 Million less than the average 10 days volume of 6.77 Million. The market cap of Robinhood stock is 9.461 Billion.
However, Robinhood stock stayed in a downtrend over the last months. The stock faced rejection from the upper trendline, which acted as a barrier to exiting the trend. Moreover, the price action shows that HOOD stock has persisted in facing selling pressure, and buyers have stayed on the back foot.
What Technical Indicators Say of HOOD Stock?
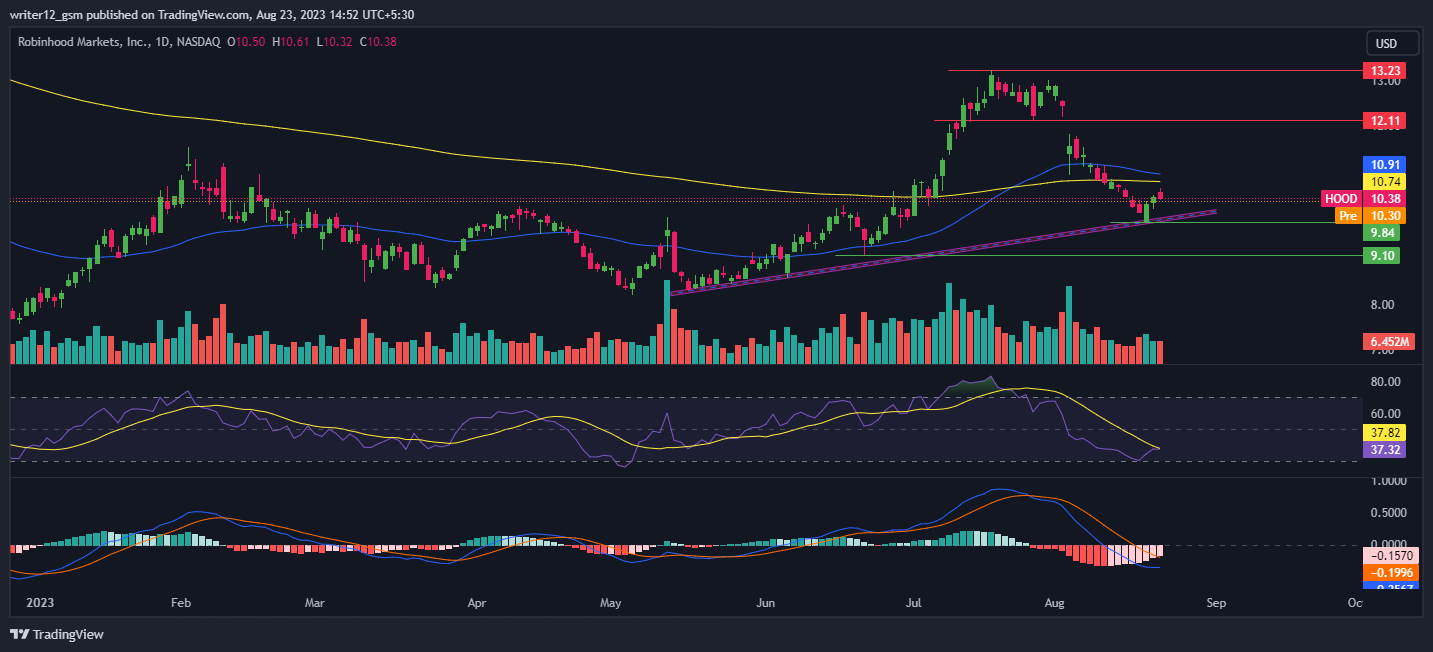
On the daily charts, HOOD stock could pull back from $9.84, as the price is near the lower trendline below the 50-day SMA, showing weakness on the charts. Recently, the stock bounced back from the channel’s lows and is headed towards the 200 EMA.
HOOD stock is now trading near the lower Bollinger band and above the 61.80% Fib level, below the 50% level, near $00. Furthermore, the chart shows sellers are gaining traction and preparing for the next bearish move.
On the 4-hour charts, HOOD stock is facing rejection from 200-day EMA and heading downwards.
The RSI curve is floating near 35.75 and showed a downfall from the neutral zone indicating sellers’ presence in the previous trading sessions.
The MACD indicator shows a bearish momentum and maintains red bars on the histogram, suggesting the bearishness of the stock.
Summary
Robinhood (NASDAQ: HOOD) technical indicators also support the bearish trend. The MACD, RSI, and EMA highlight negative signs and suggest that the downtrend may continue in the Robinhood stock price. HOOD price action suggests that the investors and traders are bullish on the 1-D time frame. The price action reflects a bullish perspective at the moment. Moreover, HOOD investors avoid the fear of missing out.
Technical Levels
- Support Levels: Nearest support levels are $10.82 and $8.77.
- Resistance Levels: Nearest resistance levels are $14.07 and $15.27.
Disclaimer
The analysis provided in this article is for informational and educational purposes only. Do not rely on this information as financial, investment, or trading advice. Investing and trading in stock involves risk. Please assess your situation and risk tolerance before making any investment decisions.
Mr. Pratik chadhokar is an Indian Forex, Cryptocurrencies and Financial Market Advisor and analyst with a background in IT and Financial market Strategist. He specialises in market strategies and technical analysis and has spent over a year as a financial markets contributor and observer. He possesses strong technical analytical skills and is well known for his entertaining and informative analysis of the Financial markets.


