
 Home
Home News
News

- 1 PFE stock price is currently trading at $36.84 with a drop of 0.46% in the last 24 hours.
- 2 PFE has a current market cap of $207.997 Billion.
Pfizer stock is trading between the key moving averages. The price has been consolidating inside the price range of $40.33 and $34.62 over the daily time frame chart. However, the PFE shares need to accumulate buyers in order to surge toward its recovery phase.

Pfizer’s stock price must initiate its recovery rally to reach the upper threshold of the consolidation phase. Meanwhile, Pfizer’s share price has slipped below the 20, 50, 100, and 200-days daily moving averages.

Pfizer’s stock price gained 2.68% in a week and 0.11% in a month. Also, Pfizer’s share price has been around -8.13% in the last three months; and -12.89% in the last six months. Moreover, Pfizer stock has registered its breakout from the consolidation phase to start a new uptrend
Technical Analysis of PFE Stock Price in 1-D Timeframe
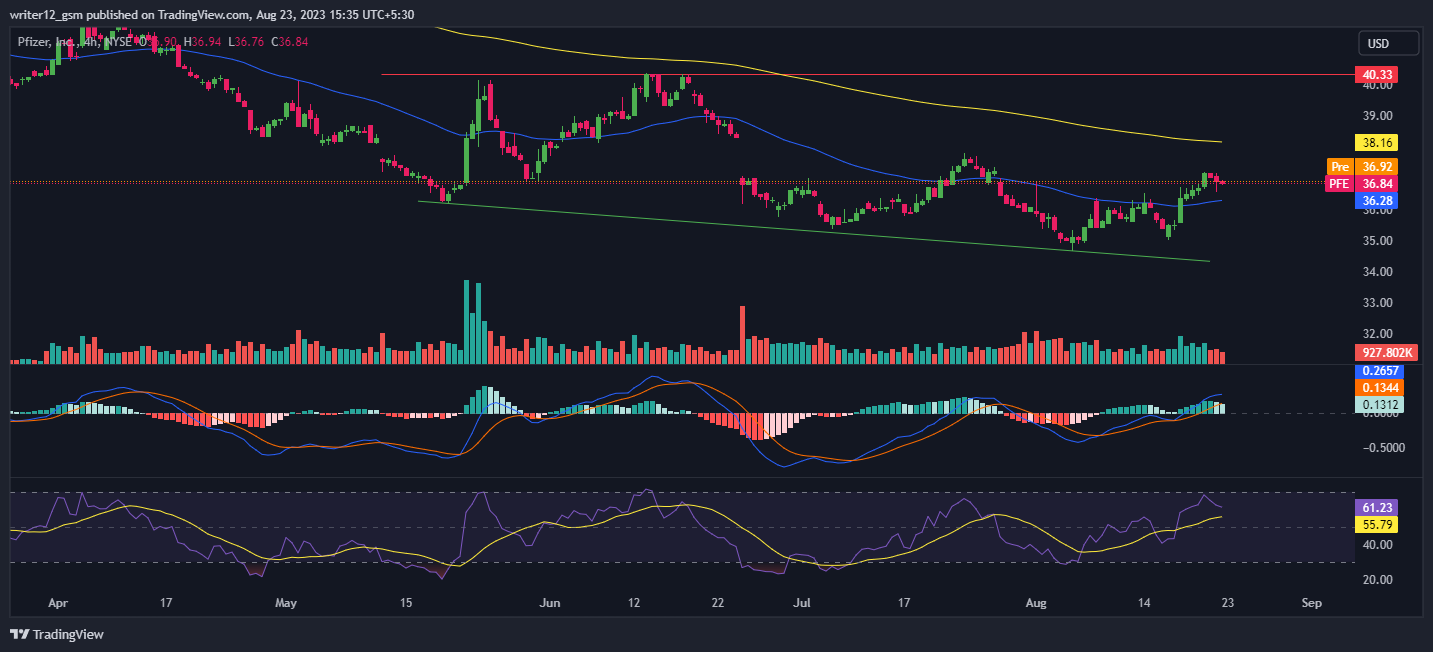
If it can sustain at this level, the PFE price could continue to go up and reach the first and second targets of $37.46 and $38.85. However, if the PFE price fails to maintain this level, then it might hit the closest support levels of $35.01 and $33.95..
Currently, Pfizer stock (NYSE: PFE ) is trading between the 50 and 200-day simple moving averages, which support the price momentum.
Nevertheless, if buying volume adds up, then the price might support bullish momentum by making higher highs and making new highs. Hence, the PFE price is expected to move upwards giving bullish views over the daily time frame chart.
Technical indicators suggest that the PFE stock price is moving upwards. The relative strength index (RSI) showcases the upward momentum of Pfizer shares. RSI was at 61 and is heading toward the oversold territory.
MACD exhibits the bearish phase of PFE share price. The MACD line is flat above the signal line heading upward. Investors in Pfizer shares need to wait to cross the 200 EMA over the daily time frame chart.
Summary
On the daily time frame chart, Pfizer’s stock price consolidated around the 50 EMA, below the 200-day EMA. However, in order to accelerate toward its recovery phase, PFE shares must attract mass purchasers. The price of Pfizer shares dropped 8.13% in a week; and 12.89% in the last six months. Technical indicators signal bearishness in the PFE stock chart. Investors in Pfizer shares must watch the daily time frame chart for any directional changes.
Technical Levels
- Support Levels: Nearest support levels are $35.01 and $33.95.
- Resistance Levels: Nearest resistance levels are $37.46 and $38.85.
Disclaimer
The analysis provided in this article is for informational and educational purposes only. Do not rely on this information as financial, investment, or trading advice. Investing and trading in stock involves risk. Please assess your situation and risk tolerance before making any investment decisions.

Nancy J. Allen is a crypto enthusiast, with a major in macroeconomics and minor in business statistics. She believes that cryptocurrencies inspire people to be their own banks, and step aside from traditional monetary exchange systems. She is also intrigued by blockchain technology and its functioning. She frequently researches, and posts content on the top altcoins, their theoretical working principles and technical price predictions.


