
 Home
Home News
News

- 1 TRX price rebounded from the 200-day EMA in an uptrend.
- 2 Buyers persist in accumulation and look to retain the highs soon.
TRON (TRX) price witnessed a slow and steady comeback from the support zone of $0.05000 in the past months and persisted in extending the gains inside the rising parallel channel. Buyers are gaining traction, and are willing to revisit the highs of $0.09000.

Moreover, TRX price shows a positive outlook amid sustained demand over past sessions. The higher highs sequence was noted on the charts with the price in bullish territory.

TRON price action suggests that buyers are looking strong, and the price rebounded from the 200-day EMA, recapturing the momentum, and is close to the 20-day EMA, which, if surpassed, leads to a sharp run toward $0.08000 in the following sessions.
TRX coin has a lower trajectory of $0.6500 which is a strong support range, and the upper trajectory is near $0.09000, the supply region, where the price faced rejection in the past sessions. However, the trend is strong, and buyers continued to pull back from the lower trendline, suggesting a positive outlook for the upcoming sessions.
At press time, TRX is trading at a price of $0.07654 with an intraday gain of 1.39%, showing a bounce from the lower trendline and indicating buyers’ traction on the charts. Moreover, the trading volume increased by 2.45% to $223.55 Million, while the pair of TRX/BTC is at 0.0000030 BTC. However, the market cap of TRX is $6.89 Billion. Analysts maintained a buy rating and suggested a growth outlook based on the technicals.
TRX Persists in Extending Gains Inside Channel On Daily Charts
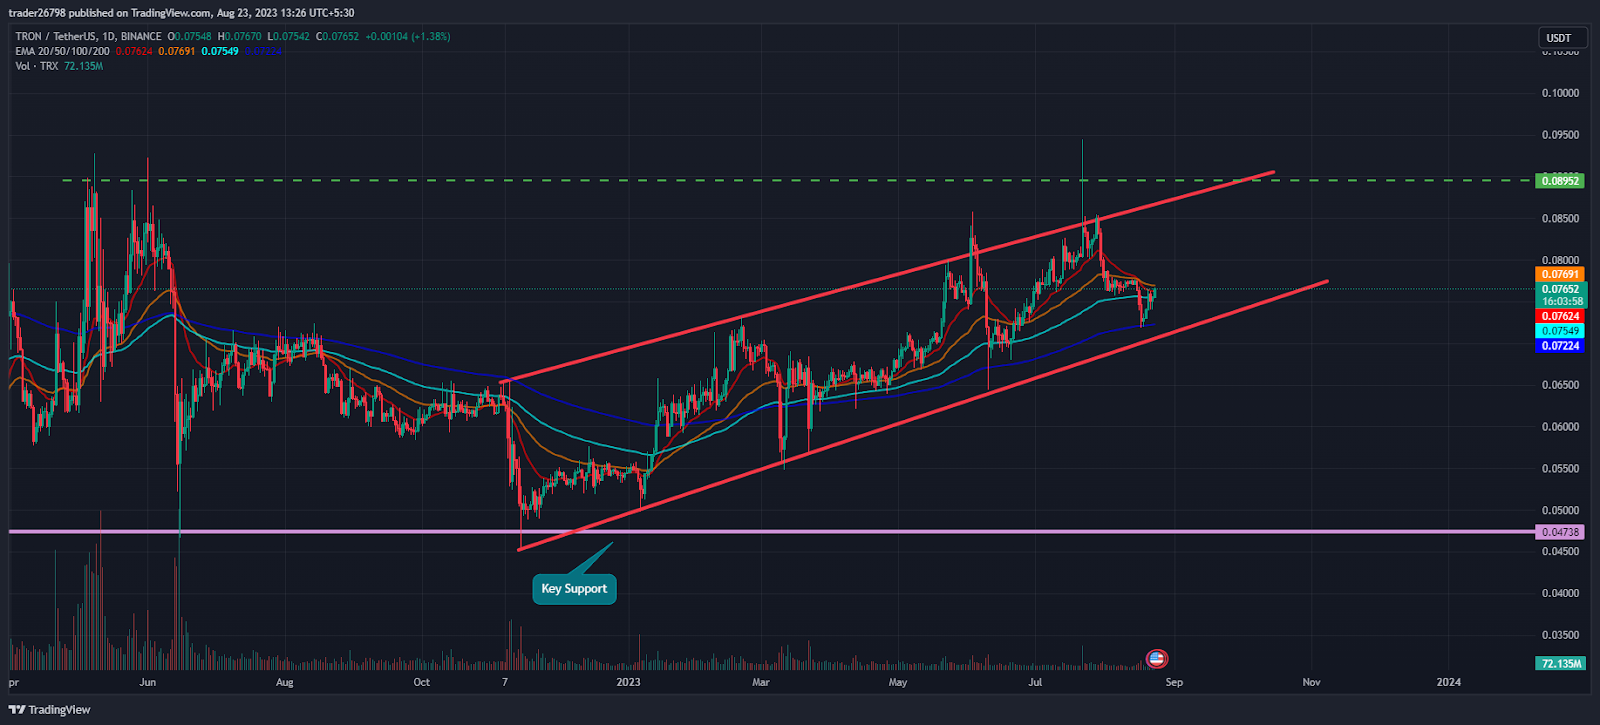
From the start of 2023, TRX price chart shows a rising parallel channel. It persisted in an uptrend and jumped over 50% from the lows of $0.6000. Furthermore, TRX has already been corrected, showing fresh trend reversal in the past sessions, and is looking to reach the highs soon. As per the Fib levels, the TRX price is trading above neutrality while the mid-Bollinger band shows strength on the charts.
What Technical Indicators Show
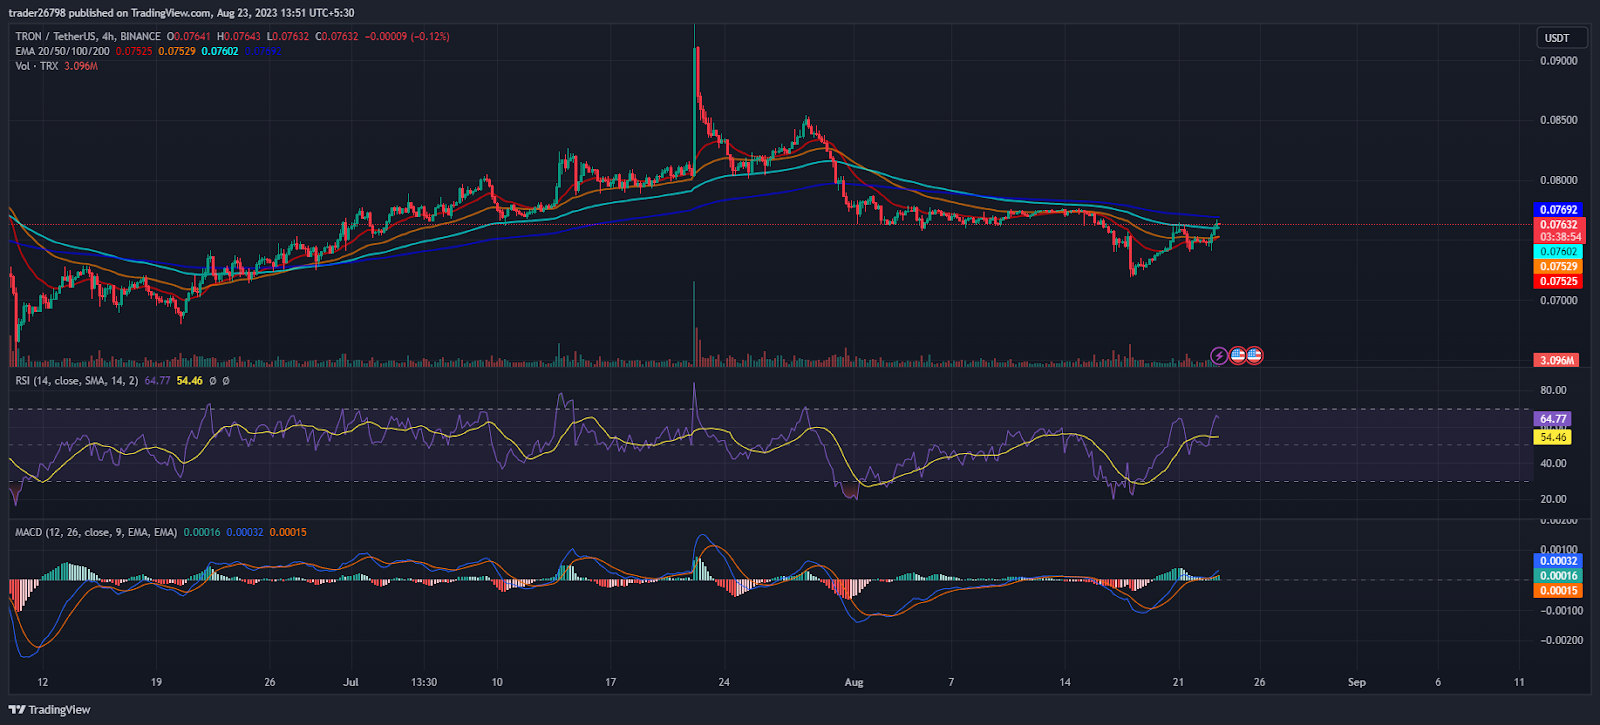
TRX price action on the short-term charts indicates a trendline breakout near the neckline and swing hurdle of $0.0.7700, which acted as a barrier for the up move.
The RSI curve stayed in the overbought zone and showed bullish divergence, suggesting a bounce in the upcoming sessions.
The MACD indicator showed a bullish crossover and green bars on the histogram, suggesting a positive outlook on the charts.
Conclusion
TRON (TRX) price shows a rising parallel channel on the charts, extending the gains and stretching the uptrend over the past sessions. Moreover, the leading indicators are giving bullish signals while the buyers continue to make a long buildup and gain traction to retain the highs of $0.09000.
Technical Levels:
Support Levels: $160 and $150
Resistance Levels: $180 and $190
Disclaimer
The views and opinions stated by the author, or any people named in this article, are for informational purposes only and do not establish financial, investment, or other advice. Investing in or trading crypto assets comes with a risk of financial loss.
Steve Anderson is an Australian crypto enthusiast. He is a specialist in management and trading for over 5 years. Steve has worked as a crypto trader, he loves learning about decentralisation, understanding the true potential of the blockchain.


