
 Home
Home News
News
- 1 DYDX crypto shows narrow-range moves and is near the breakout zone.
- 2 Buyers are attempting to surpass the cluster of $2.30 and attaining momentum.
DYDX token price is hovering inside the cage and showing consolidation near the round mark of $2.00 for the past sessions. Recently, DYDX surpassed the 200-day EMA in a giant upmove, indicating that fresh buying interest has started and buyers are gaining traction.
Moreover, price action shows long buildup activity and a range breakout above $2.300 in the upcoming sessions. In the last session, DYDX showed a massive bullish engulfing candle, which surpassed the chart, showing that the DYDX token surpassed the significant moving averages in a single go.

DYDX token has an upper trendline, which is the immediate resistance if it surpasses leads to a massive rally toward the round mark of $2.500. Conversely, if the token faced rejection near the upper end of the cage at $2.200, it would retest $2.00.
DYDX token price action shows a fresh bull move – a reversal from the support mark of $1.350. Buyers persisted in accumulation, but the token consolidated due to the strong seller grip near the round mark of $2.00. Recently, DYDX attained momentum, and the trapped sellers and buyers have trained their muscles to surpass the upper trendline near $2.300.
At press time, the DYDX token is trading at $2.189 with a massive intraday gain of 10.52%, showing bullishness on the charts. Moreover, the trading volume increased by 19.81% to $92.30 Million, and the pair of DYDX/BTC is at 0.000083 BTC. However, the market cap of DYDX is $121.84 Million.
DYDX Price Action on Daily Charts
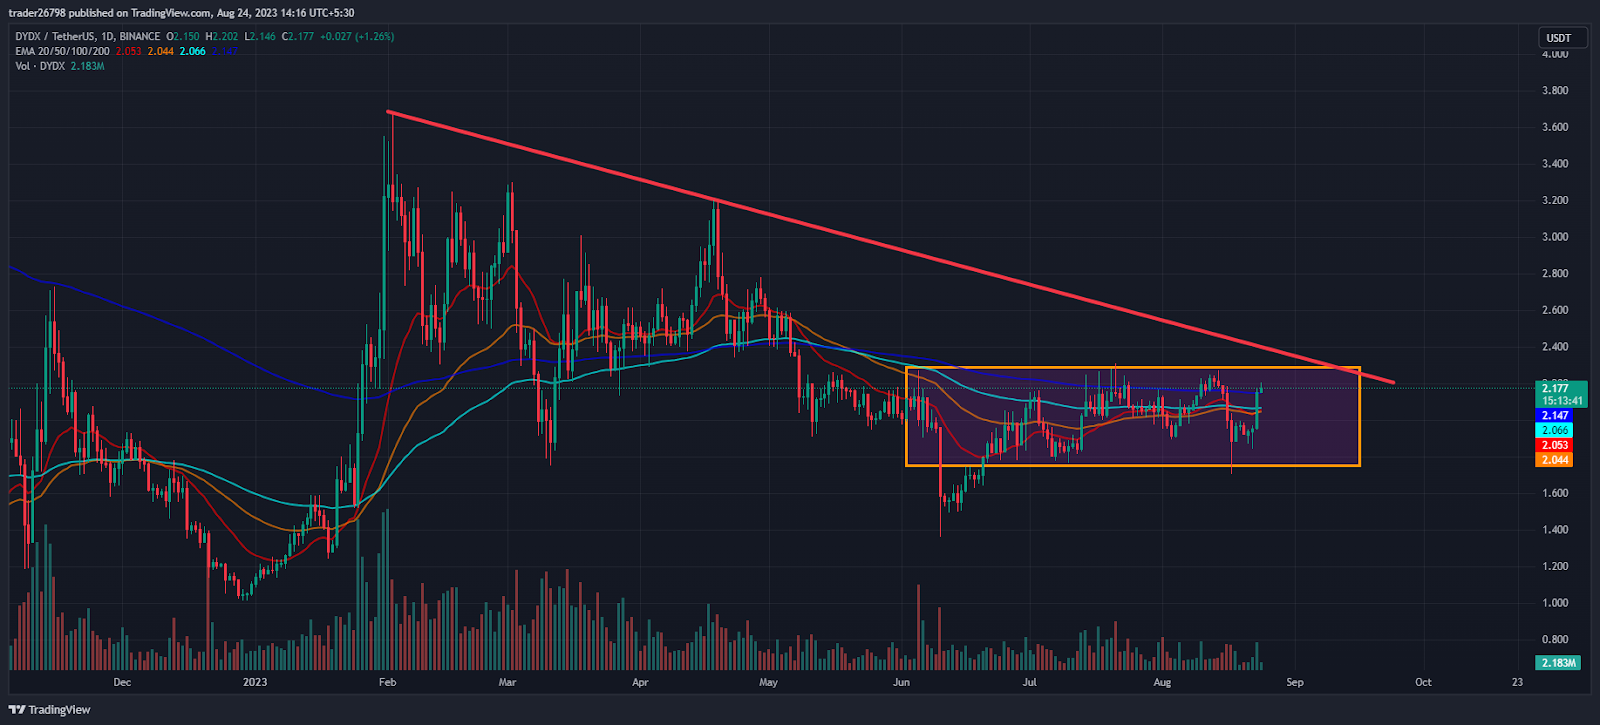
DYDX token price shows consolidation and is looking to surpass the neckline of $2.30 to skyrocket toward $2.50. Moreover, the token decisively sustained above the round mark of $2.00, showing that buyers are gaining traction. Moreover, the price surpassed the upper bollinger band and is looking to retain the 50% Fib zone.
DYDX Short Term Charts Indicate Reversal
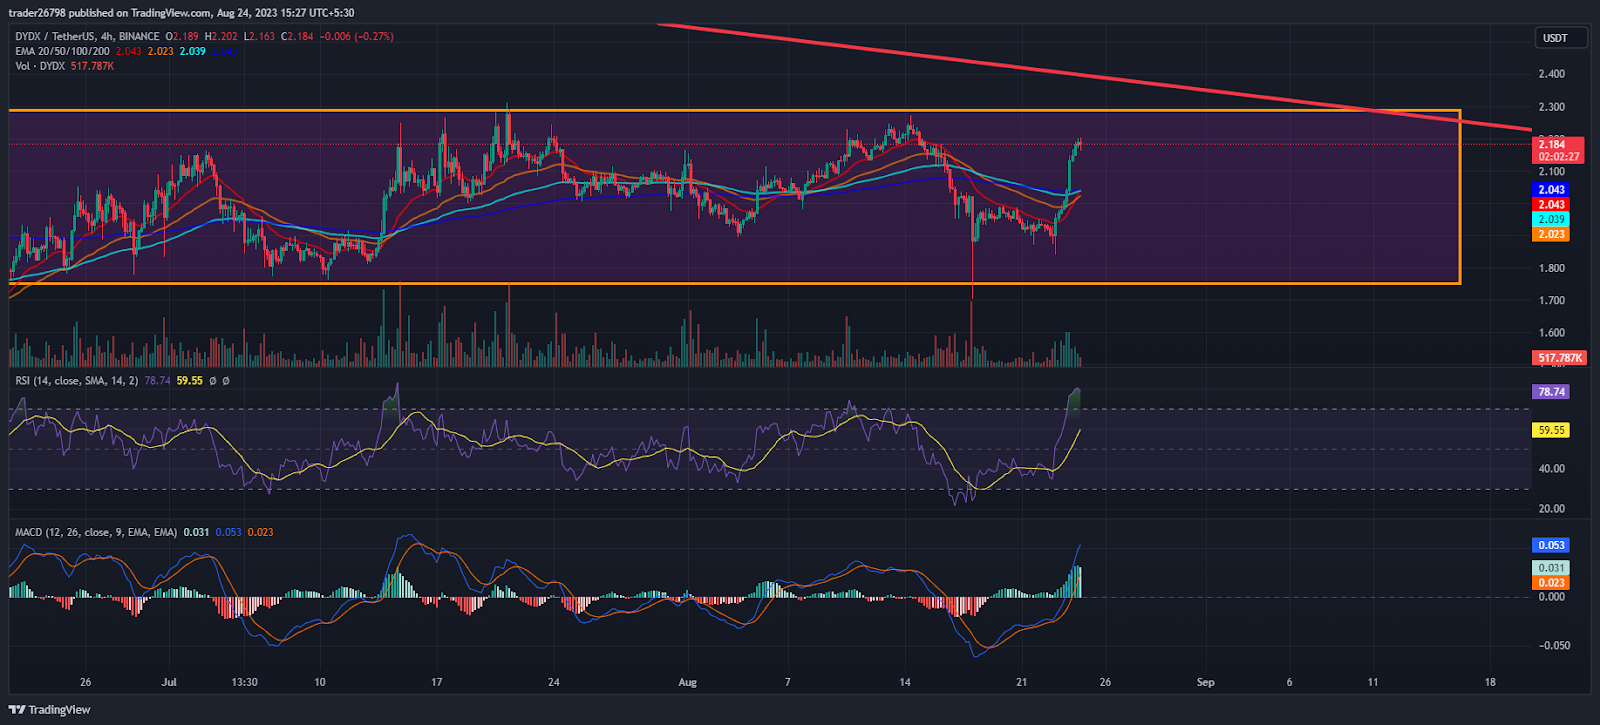
DYDX token indicates a fresh reversal and the beginning of an uptrend. However, buyers need to break the neckline of $2.300 to initiate a rally.
The RSI curve bounced and stayed in the overbought zone, showing a bullish divergence on the charts.
The MACD indicator showed a bullish crossover and formed green bars on the histogram, indicating a positive outlook on the charts.
Conclusion
DYDX token price has surpassed the 200-day EMA and is trading above the cluster of $2.00, showing trend reversal indications on the charts. Furthermore, the price action shows that sellers are trapped and started covering their positions, resulting in the bounce from the support zone in the last trading session.
Technical Levels:
Support Levels: $2.00 and $1.70
Resistance Levels: $2.30 and $2.50
Disclaimer
The views and opinions stated by the author or any people named in this article, are for informational purposes only and do not establish financial, investment, or other advice. Investing in or trading crypto assets comes with a risk of financial loss.
Steve Anderson is an Australian crypto enthusiast. He is a specialist in management and trading for over 5 years. Steve has worked as a crypto trader, he loves learning about decentralisation, understanding the true potential of the blockchain.


