
 Home
Home News
News
- 1 FDX stock price showed an up-move and continued to extend the gains.
- 2 Buyers are attaining strength and accumulating.
FedEx Corporation (FDX stock) chart shows a rising parallel channel and extending the gains for the past sessions. Moreover, the price action shows that FDX stock has gained traction after breaking out of the neckline near $240 in a sharp move. Moreover, the Q2 earnings led to positive sentiment and with the stock stretching the rally beyond the hurdles.
Furthermore, the FDX stock was trading above neutrality and surpassed the round mark of $250 in the past sessions, showing massive buyer interest on the charts. Buyers have remained strong and persisted in accumulating, resulting in the surge.

Moreover, the FDX stock chart structure showed bullishness and suggested a path curve toward $300 for the following sessions. From the start of 2023, FDX stock has continued extending the reversal and entered the bull trajectory now. The stock has an upper trajectory of $300, which buyers are willing to fetch soon. Conversely, if any correction happens, the immediate swing of $240 is the strong support zone.
At press time, FDX stock price was $260.45 with an intraday gain of 0.57%, showing bullishness on the charts. Moreover, the trading volume increased by 0.34% to 1.787 Million, and the market cap of FDX stock is $65.506 Billion. However, analysts maintained a neutral rating, and the stock is trading close to the yearly target price of $266.78.
FedEx Corp. is a holding company that provides transportation, e-commerce, business services, and business solutions. It operates through the following segments: FedEx Express, FedEx Ground, FedEx Freight, FedEx Services, and Corporate, Other, and Eliminations.
The FedEx Express segment offers transportation and delivery services. The Ground segment provides small-package ground delivery services. The FedEx Services segment includes sales, marketing, information technology, communications, customer service, etc.
FDX Stock Surging Inside the Rising Channel on Daily Charts
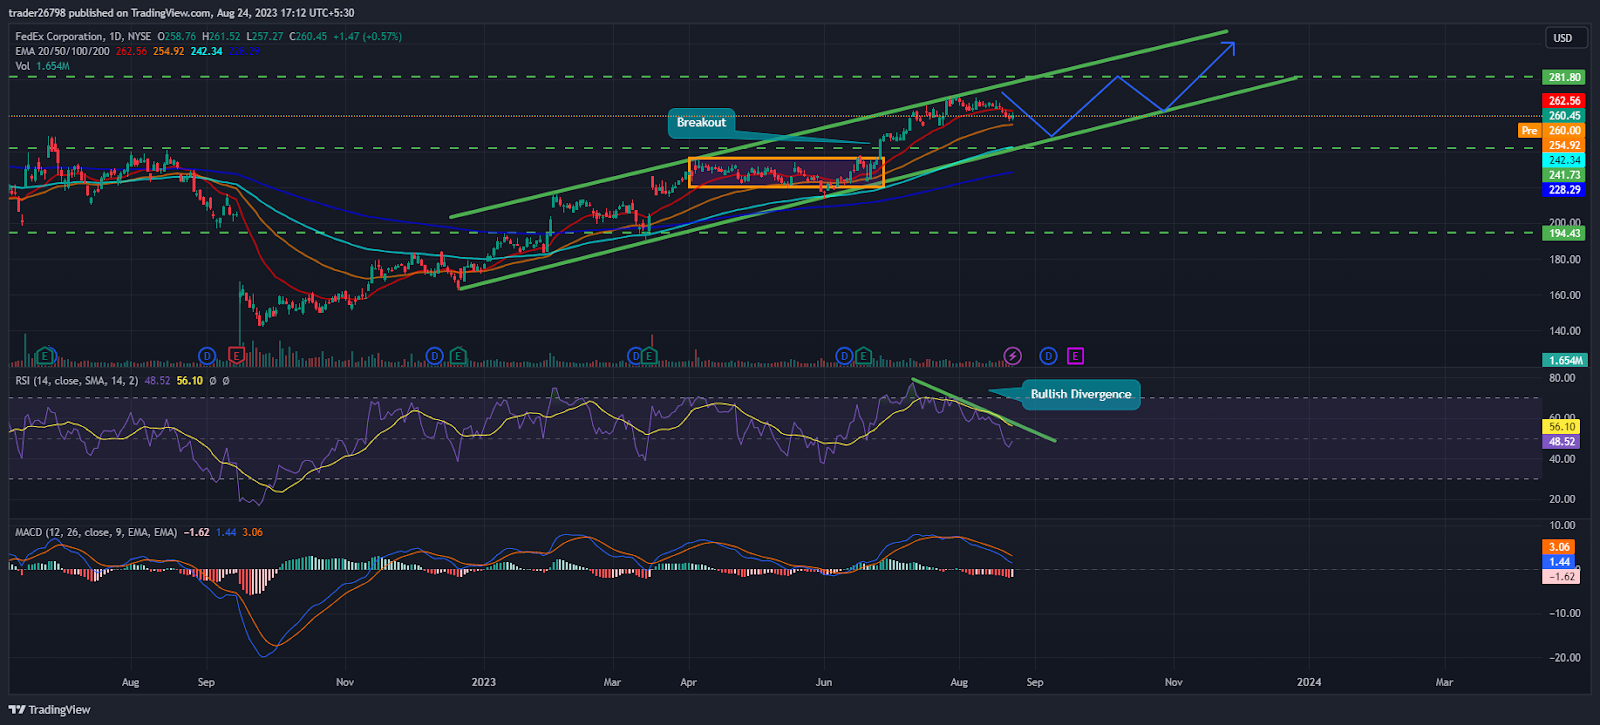
FDX stock price showed a massive rally from the lows of $150 to the current spot levels of $260, gained over 60% in the past months, and maintained gains on the top.
Moreover, the technical structure suggests that if the price sustains above the mark of $260 near the 50-day EMA, this move will likely extend toward the cluster of $280, followed by $300 in the subsequent sessions. Undoubtedly, this rally trapped sellers in the past sessions, and buyers took advantage of this move and continued making long build-ups to stretch the rally beyond the limits.
The RSI curve stayed near neutrality and showed a bullish divergence, suggesting that the stock will skyrocket in the upcoming sessions.
The MACD indicator showed a bearish crossover, but the red bars plotted on the histogram did not indicate signs of selling pressure and maintaining neutrality.
Conclusion
FDX stock price is in a bullish trajectory and persisted in extending the gains inside the rising channel in the past sessions. Moreover, the technicals show buyers’ dominance and indicate that the rally would continue in the following sessions toward the round mark of $300.
Technical Levels:
Support Levels: $250 and $240
Resistance Levels: $270 and $280
Disclaimer
The views and opinions stated by the author or any people named in this article, are for informational purposes only and do not establish financial, investment, or other advice. Investing in or trading crypto assets comes with a risk of financial loss.

Andrew is a blockchain developer who developed his interest in cryptocurrencies while pursuing his post-graduation major in blockchain development. He is a keen observer of details and shares his passion for writing, along with coding. His backend knowledge about blockchain helps him give a unique perspective to his writing skills, and a reliable craft at explaining the concepts such as blockchain programming, languages and token minting. He also frequently shares technical details and performance indicators of ICOs and IDOs.


