


KSS stock price has been in an inclining trend for the last three months after the formation of an inverted head and shoulders at the bottom of a declining trend. The price surged nearly 50% from the bottom in less than three months.
The pre-earning sentiments led to some profit booking after a short-term gain and the price slid. The disclosure of quarterly earnings triggered the market to open a gap-down of 5% followed by another decline of 5% due to panic selling.
However, the stock gained support from the 200 EMA and surged more than 5% on the last day to recover from the decline. The optimistic quarterly results encouraged investors to hold for more gains in the coming sessions. The earnings were reported as 3.67 Billion beating the expectations by a massive 122%. The revenue missed Wall Street expectations by 2%.
Kohl’s Corp. (NYSE: KSS) is a U.S. retailer that sells a variety of products online and in-store. It targets middle-class customers with affordable clothing, shoes, accessories, beauty, and home goods.
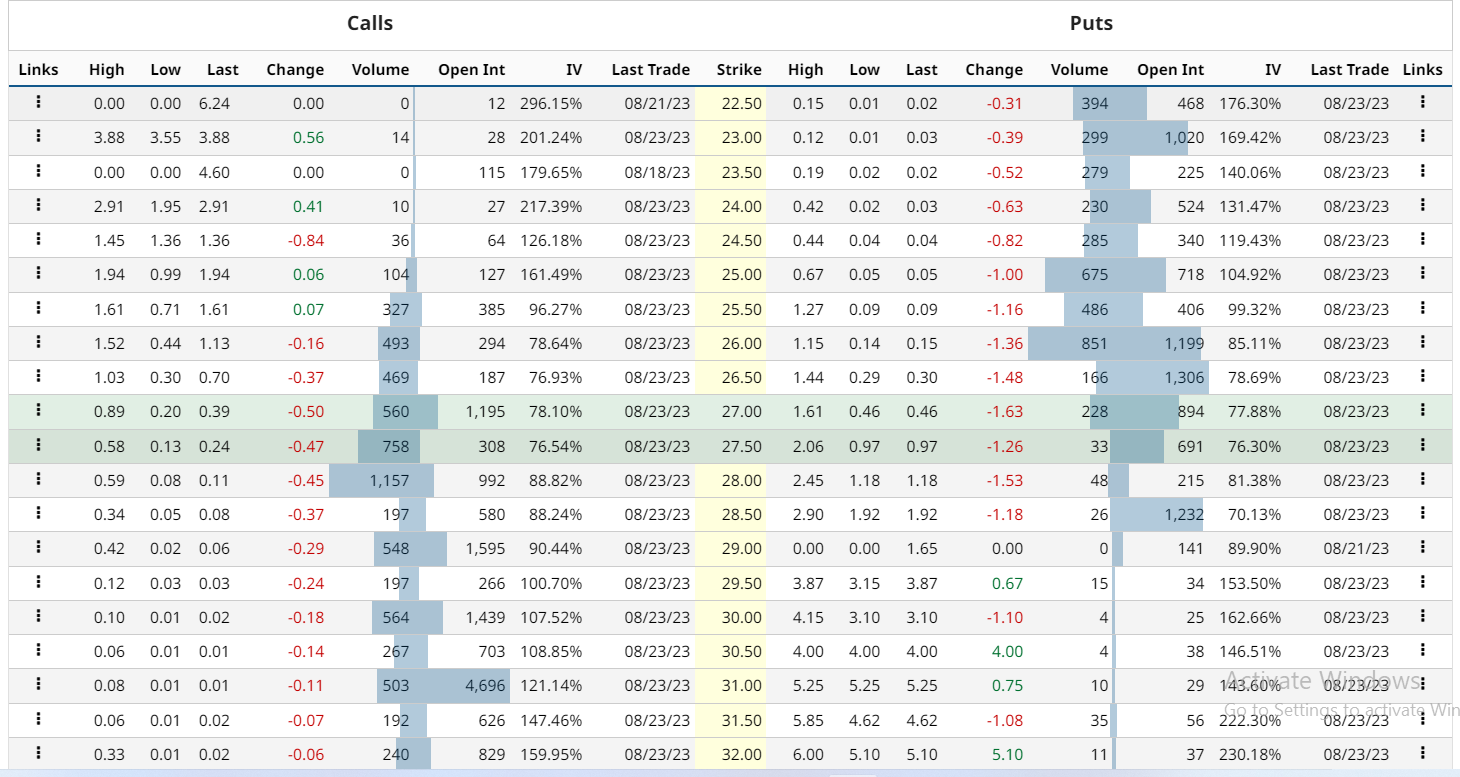
KSS stock option-chain analysis states that the current implied volatility in the market is 47.5% with a decrement of 17.27% in the last trading session. The at-the-money strike price has 228 open contracts on the put side and 1195 open contracts on the call side indicating the dominance of sellers at the current level. The PUT/CALL ratio is 0.89 indicating that sellers dominating at the moment as per the data.
KSS Stock Price Forming A Bullish Flag Pattern In the 4 Hour Chart
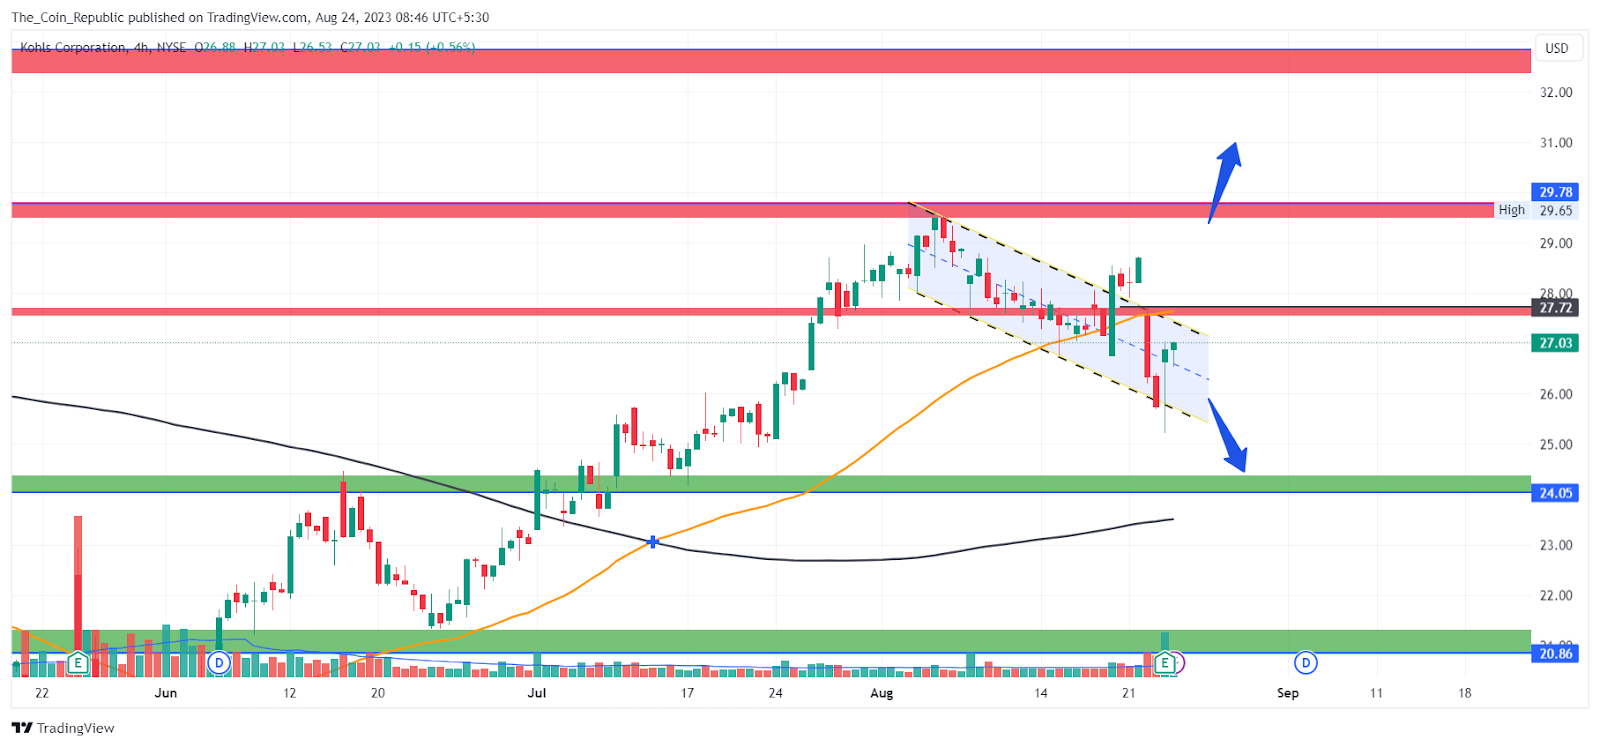
The KSS stock price currently trades at $27.03 and trying to recover after the fall due to disclosure of the results.
The short-term outlook for the stock is neutral until the price maintains itself in the channel. The price is trading at a very crucial zone. The breakout of the bullish flag pattern may trigger another hike in the price and the stock may surge to resume its trend.
However, the breakdown of the flag pattern may trigger a panic selling as the stock has been in an uptrend since the last quarter. The Investors may look for a profit booking and the stock may decline further.
The EMAs Showing Strength Over The Daily Chart.

The daily KSS stock price chart shows that the price is trading above 200 and 50 EMA indicating a strong uptrend in the long term.
The overall Technical Opinion rating including RSI and MACD is signaling a 48% buy with the weakening short-term outlook on maintaining the current direction.
Conclusion
KSS stock price prediction concludes that the stock price rose 50% in three months after a bullish reversal pattern. It fell 10% after the earnings release but recovered 5% on positive results. The stock is trading in a channel and may break out or break down. The outlook is neutral until the direction is clear.
Technical Levels
- Support levels: $24.05 and $20.86.
- Resistance levels: $27.72 and $29.78.


