
 Home
Home News
News

- 1 ETH chart shows a downtrend.
- 2 Buyers are beginning to unwind their positions and losing traction.
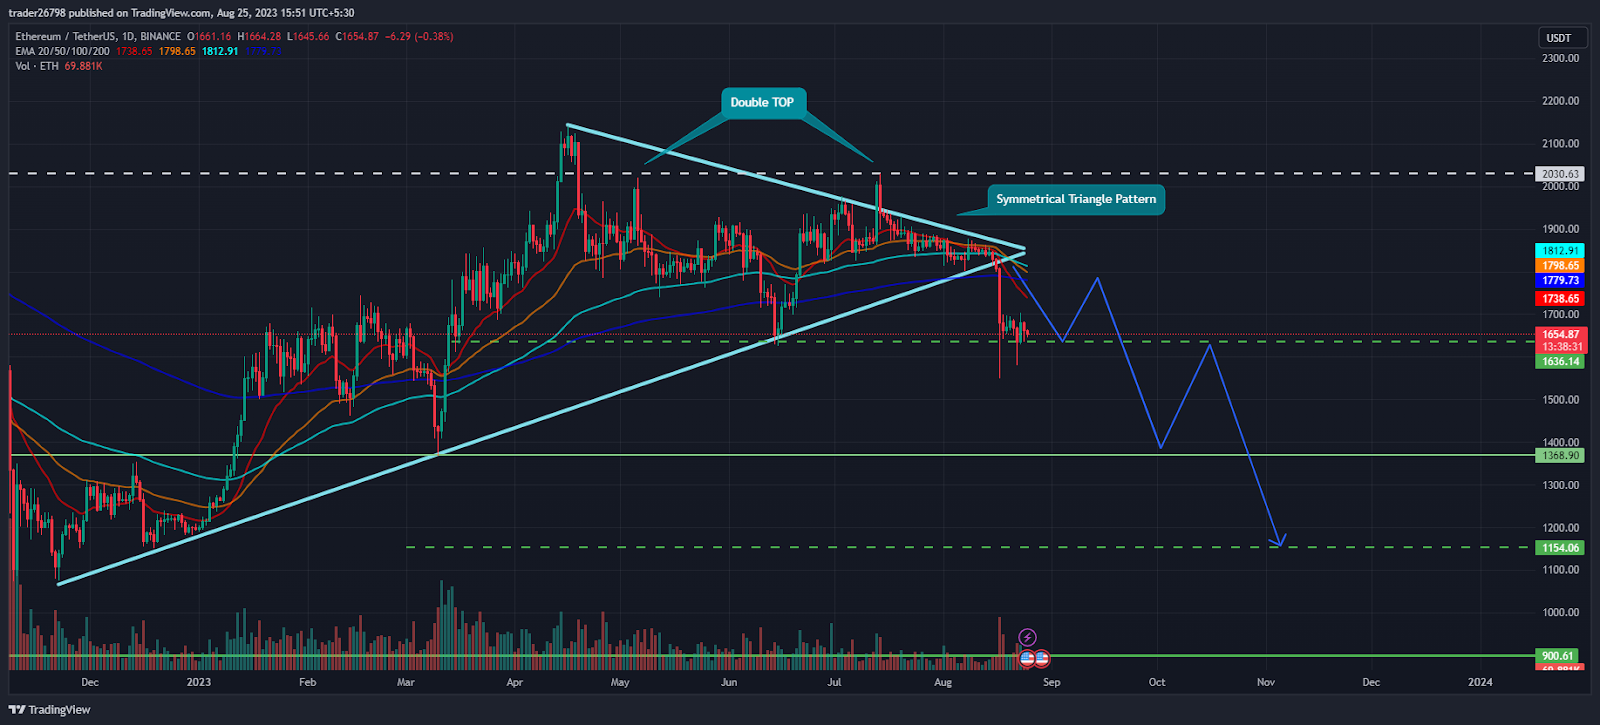
Ethereum (ETH) price exhibited selling pressure and shattered the primary cluster of $1800, signifying the beginning of a downtrend. Furthermore, ETH has shown a breakdown of the symmetrical triangle pattern, flowing near the immediate support of $1650.

Ethereum price action suggests buyers failed to sustain near $2000, faced rejection near the supply region, and glimpsed distribution in the last sessions. Moreover, ETH price has now descended below the 200-day EMA, indicating seller dominance on the charts.

After the breakdown, Ethereum price dwelled in a range and made small candles, suggesting that buyers are trying to rescue the gains. Still, due to massive selling pressure, they are not thriving, resulting in consolidation. Moreover, ETH technical indicators suggest follow on selling toward the demand zone of $1100, as shown by the chart’s path curve.
ETH price is trading near the mid trajectory, which, if it breaks, leads to a free fall toward the primary support of $1500. Buyers are trying to cover the region and attempt a recovery. However, selling pressure was witnessed on the charts with $1600 being tested multiple times this week.
At press time, ETH price was $1652 with an intraday drop of 0.60%. Moreover, the trading volume remained average at $6.60 Billion, and the pair of ETH/BTC is at 0.0633 BTC. However, the market cap of ETH is $202.39 Billion. Moreover, analysts maintained a sell rating and suggested a fall for the upcoming sessions.
ETH Price Floats Near Support of $1650 on Daily Charts
Ethereum (ETH) price was trading near the 50% Fib cluster and noted a setback from the top of $2000 in the last weeks. Moreover, the price action shows that ETH recorded a massive rally during the beginning of 2023 and endured in gaining, and sellers stayed on the back foot. However, the momentum is diverting now, and sellers again came into action, made aggressive short positions, and whipped the bulls, resulting in correction.
Ethereum on Short Term Charts Shows Seller Dominance

Ethereum price is hovering near the round mark of $1650 and shelving for an aggressive move in the following sessions. Higer up, resistances were placed near $1700 and $1750, near the 200-day EMA. On the lower side, the primary support of $1500 is there, which buyers will retest in the following sessions.
The RSI curve stayed near 50 and showed bearish divergence on the charts, suggesting an adverse price action and a down move for the following sessions.
The MACD indicator showed a bullish crossover and formed green bars on the histogram. However, price action still did not give a confirmation for buyers to make fresh long positions.
Summary
Ethereum (ETH) price suggests a fall toward $1500, followed by $1200 in the upcoming weeks. Moreover, the price action indicates a negative outlook, and sellers persisted in making short buildup, which suggests that bears are dominating. Bulls were trapped, resulting in a continuous decline on the charts.
Technical Levels
Support Levels: $1500 and $1300
Resistance Levels: $1700 and $1850
Disclaimer
The views and opinions stated by the author, or any people named in this article, are for informational purposes only, and they do not establish financial, investment, or other advice. Investing in or trading crypto or stock comes with a risk of financial loss.

Adarsh Singh is a true connoisseur of Defi and Blockchain technologies, who left his job at a “Big 4” multinational finance firm to pursue crypto and NFT trading full-time. He has a strong background in finance, with MBA from a prestigious B-school. He delves deep into these innovative fields, unraveling their intricacies. Uncovering hidden gems, be it coins, tokens or NFTs, is his expertise. NFTs drive deep interest for him, and his creative analysis of NFTs opens up engaging narratives. He strives to bring decentralized digital assets accessible to the masses.


