
 Home
Home News
News
- 1 CVX stock is trying to gain momentum and looking for a bounce to revisit $180.
- 2 Buyers have attained strength and are attempting for a breakout.
Chevron Corporation (CVX stock) price chart shows an ascending triangle pattern. The price is consolidating in a narrow range after breaking out of the upper trendline.
Moreover, CVX stock made a double bottom pattern near the strong support zone of $150 and back from there. However, the CVX share price is close to the 200-day EMA, which acts as an obstacle in raising the momentum and reflects slow and steady moves in the past sessions.
CVX stock is trading above the cluster of $150, showing a positive outlook and bullish signals on the charts. Furthermore, the stock has driven the gains above neutrality and is looking to retest the uncertain gap near $160.
However, CVX stock is trading in a narrow congestion zone, which did not give indications of any significant bounce or fall.
Despite the trendline breakout, the stock failed to gain momentum, indicating the sellers’ strong presence. Buyers need to overtake the $165 hurdle to reach $180. Meanwhile, sellers must bust $150 to make it to $135. However, the technicals are suggesting an upward momentum.
At press time, CVX stock price is trading at $159.12 with an intraday gain of 0.75%, showing neutral indications on the charts. Moreover, the trading volume remained average at 5.765 Million, and the market cap is $303.573 Billion. Furthermore, analysts have maintained a buy rating with a yearly target price of $185.62, suggesting a growth outlook for the upcoming sessions.
About Chevron Corporation
Chevron Corp. provides administrative, financial management, and technology support for energy and chemical operations. It operates through the Upstream and Downstream segments.
The Upstream segment consists of the exploration, development, and production of crude oil and natural gas, the liquefaction, transportation, and regasification associated with liquefied natural gas, the transporting of crude oil by major international oil export pipelines, the processing, transporting, storage, and marketing of natural gas, and a gas-to-liquids plant.
CVX Stock Price Action on Daily Charts
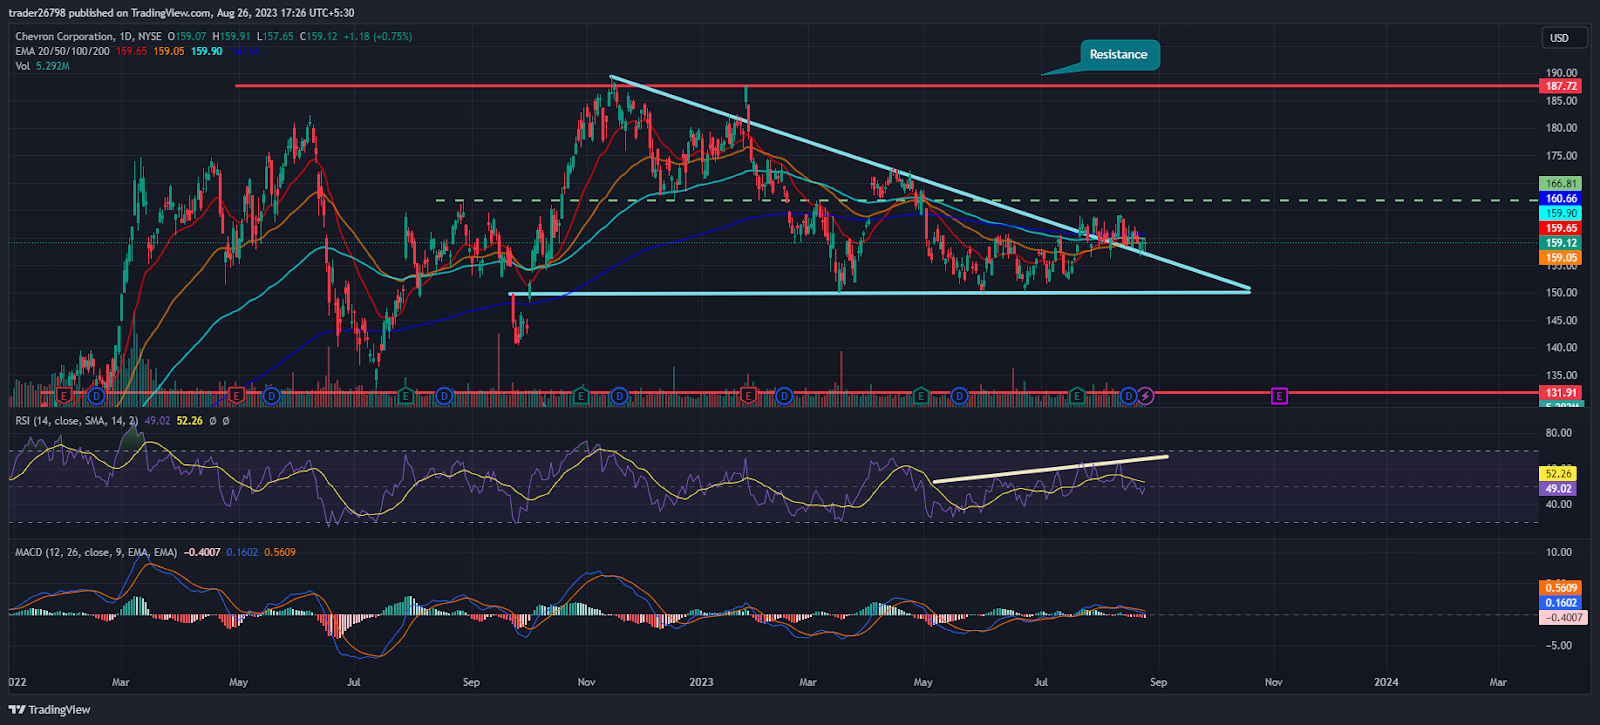
On the daily charts, CVX stock price is trading close to the 200-day EMA awaiting a consolidation breakout above the neckline of $162. Moreover, the price action favors a bounce and suggests a healthy bullishness for the near term. In the past months, sellers have tried to break the cluster of $150 but failed to break, and buyers have protected the zone and revamped from there.
The RSI curve stayed near 50, showing a positive crossover and suggesting a bullishness in the upcoming sessions.
The MACD indicator shows a neutral view and. The convergence of the MA line with the signal line indicates consolidation.
Summary
CVX stock price shows consolidation and hovers near the 200-day EMA, waiting for a breakout to revisit the swing of $180. However, the trend is strong, and stock will skyrocket soon. The price action is giving a positive outlook, and buyers continue to make long build-ups.
Technical Levels
Support Levels: $150 and $145
Resistance Levels: $165 and $180
Disclaimer
The views and opinions stated by the author, or any people named in this article, are for informational purposes only, and they do not establish financial, investment, or other advice. Investing in or trading crypto or stock comes with a risk of financial loss.

With a background in journalism, Ritika Sharma has worked with many reputed media firms focusing on general news such as politics and crime. She joined The Coin Republic as a reporter for crypto, and found a great passion for cryptocurrency, Web3, NFTs and other digital assets. She spends a lot of time researching and delving deeper into these concepts around the clock, and is a strong advocate for women in STEM.


