
 Home
Home News
News

- 1 RIG stock price is up by 1.45% in the last trading session and is currently trading at $7.72.
- 2 Transocean Inc. stock price (NYSE: RIG) is forming a bullish flag pattern on the daily chart.
RIG stock price has been in an inclining trend with a year-to-date yield of 71% and a more than 105% return in the last year. The stock has been continuously rising, forming higher highs and higher lows.
Recently, the mixed sentiments before the earnings led the stock to consolidate in the range with resistance at $9 and support at $7.50. However, the sentiments remained the same even after the disclosure of the results, and the stock continued with the consolidation.

The stock is currently forming a bullish flag pattern and declining to stay near the previous support zone and 50 EMA which may halt the decline and the price may get an upthrust.
Transocean Inc. (NYSE: RIG) is the world’s leading offshore drilling company. It provides rigs, equipment, services, and personnel for oil and gas exploration and development. Transocean operates on a contract basis in various offshore locations.
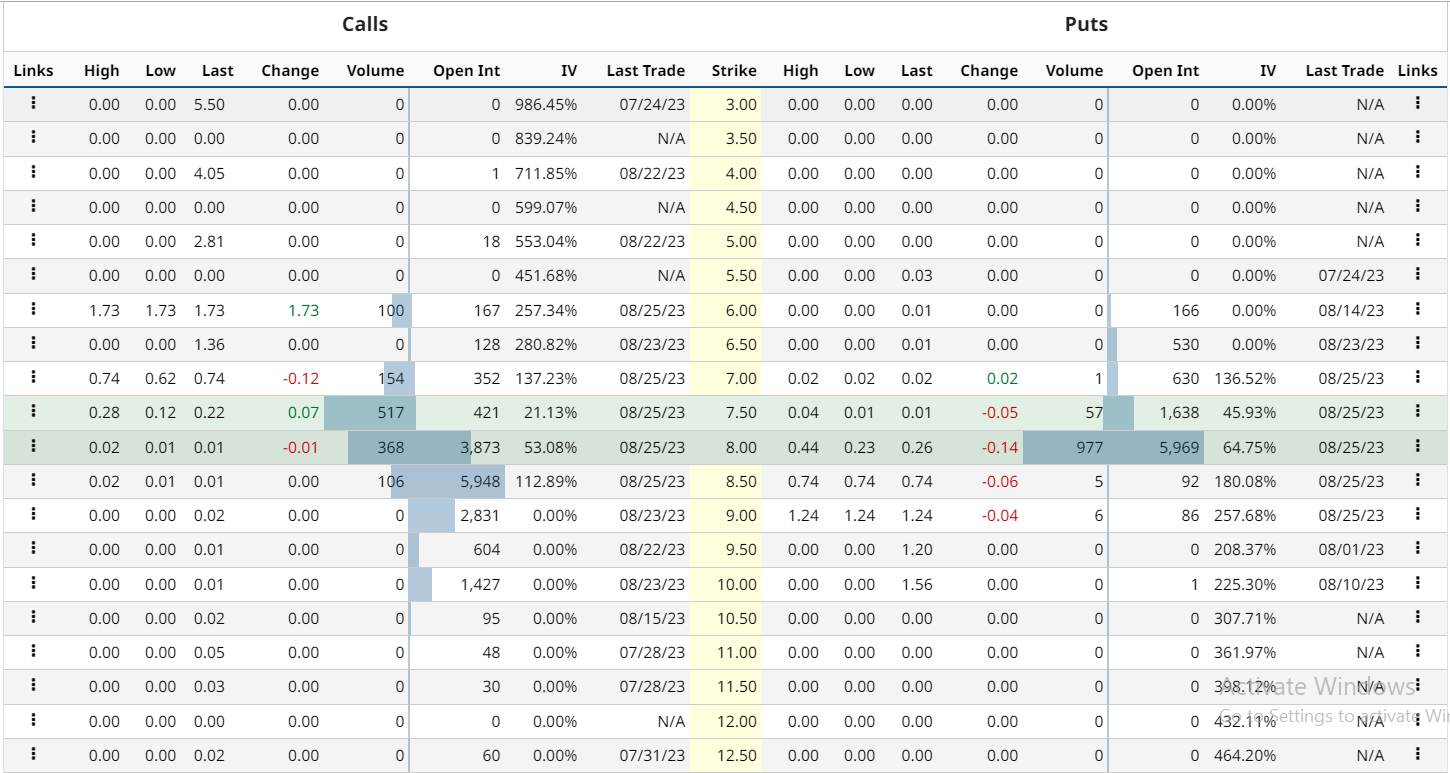
RIG stock option-chain analysis states that the current implied volatility in the market is 50.49% with a decrement of 1.93% in the last trading session. The at-the-money strike price has 630 open contracts on the put side and 352 open contracts on the call side indicating the dominance of buyers at the current level. The PUT/CALL ratio is 0.63 indicating that sellers dominate the overall option chain data.
RIG Stock Price Forming A Bullish Flag Pattern Over The Daily Chart
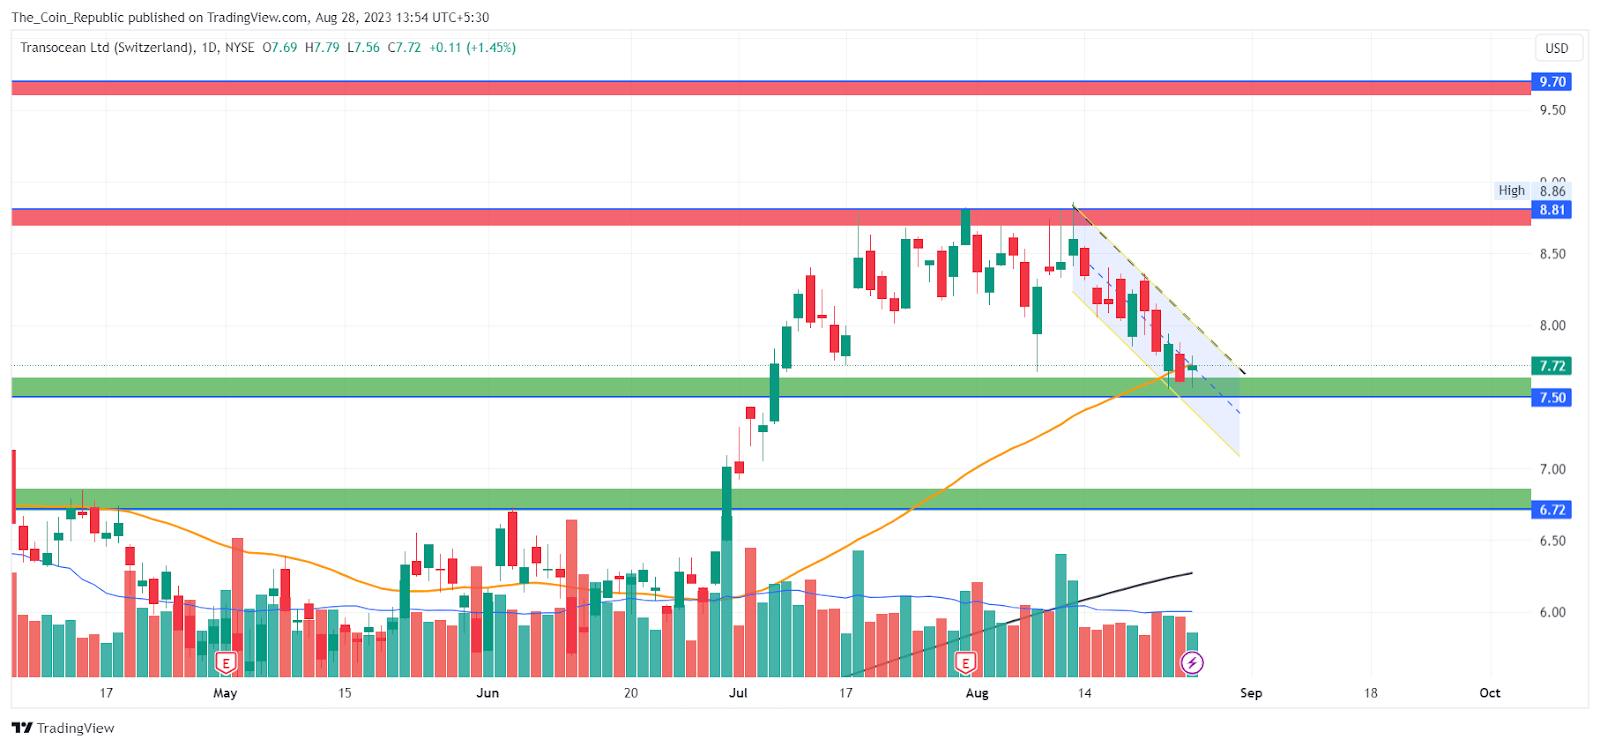
The RIG stock price currently trades at $7.72 forming a bullish flag over the daily chart.
The short-term outlook for the stock is neutral until the price trades below the upper trendline of the channel. The breakout of the channel may again turn the short-term outlook bullish.
Also, the price is bullish in the long term and surging continuously after a short-term pullback. The price may try to maintain its long-term trend with some short-term pullbacks.
The EMAs Showing Strength Over The Daily Chart
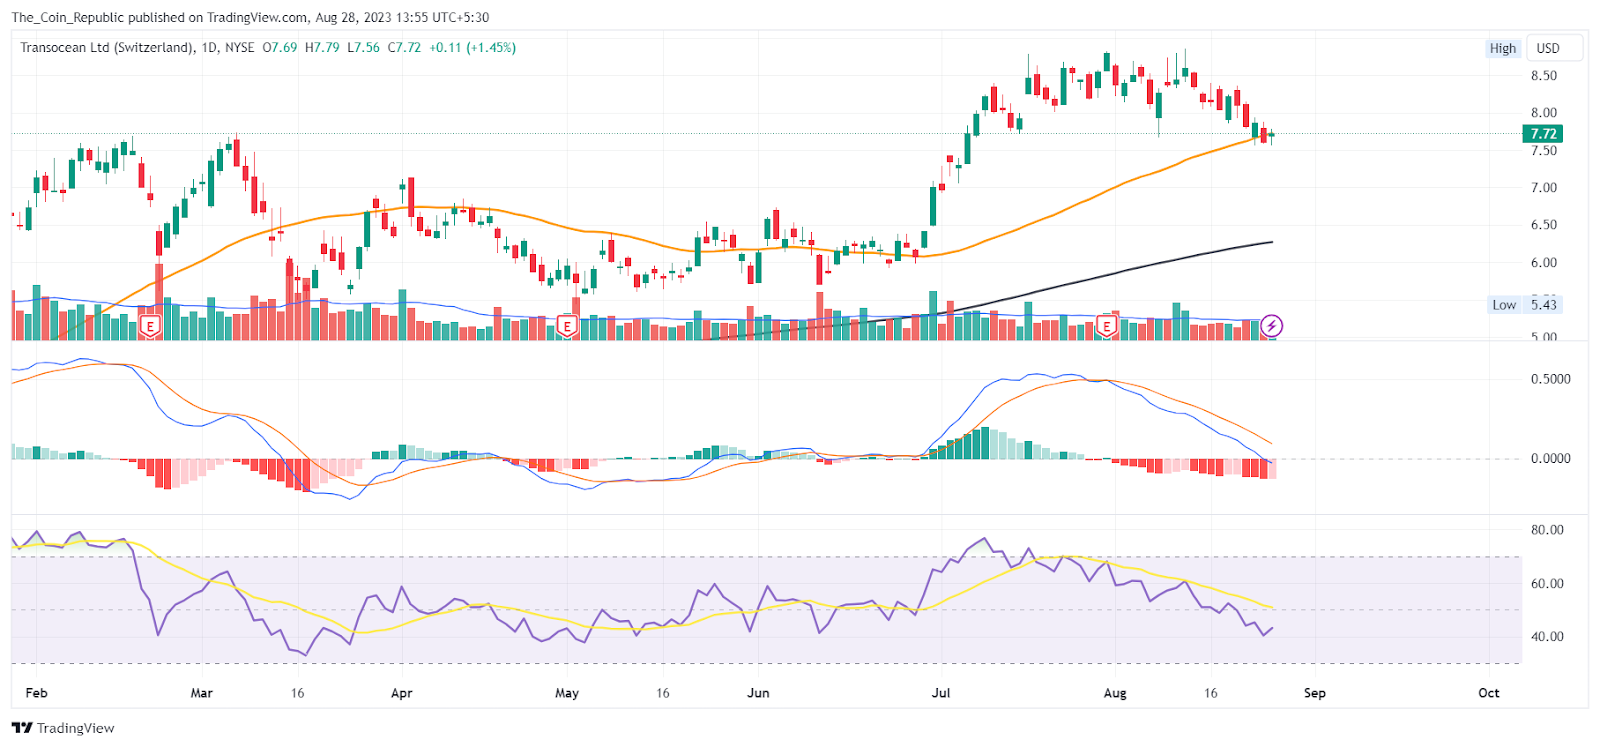
The daily RIG stock price chart shows that the price is trading above 200 and 50 EMA indicating a strong uptrend in the long term.
The overall Technical Opinion rating including RSI and MACD is signaling a 56% buy with the weakening short-term outlook on maintaining the current direction. The long-term indicators fully support the continuation of the current trend.
Conclusion
RIG stock price has been rising steadily with high returns in the last year. The stock has been consolidating in a range before and after the earnings report. The stock is forming a bullish flag pattern near the support zone and 50 EMA. The stock is neutral in the short term until it breaks above the channel. The stock is bullish in the long term and may continue its uptrend with some pullbacks. Transocean Inc. is the world’s leading offshore drilling company.
Technical Levels
- Support levels: $7.50 and $6.72.
- Resistance levels: $8.81 and $9.70.
Disclaimer
The views and opinions stated by the author, or any people named in this article, are for informational purposes only and do not establish financial, investment, or other advice. Investing in or trading crypto or stock comes with a risk of financial loss.

Nancy J. Allen is a crypto enthusiast, with a major in macroeconomics and minor in business statistics. She believes that cryptocurrencies inspire people to be their own banks, and step aside from traditional monetary exchange systems. She is also intrigued by blockchain technology and its functioning. She frequently researches, and posts content on the top altcoins, their theoretical working principles and technical price predictions.


