
 Home
Home News
News
- 1 Disney stock price is currently trading at $84.28 with a drop of -0.14% in the last 24 hours with DIS having a current market cap of $154.005 Million.
- 2 DIS stock is facing bearish pressure and breaking key support levels.
Disney’s stock price faced rejection from the upper levels and kept on falling by forming lower lows. DIS price action showcases that the trend is in a downward direction and shows bears’ continued dominance on a higher level. It formed a bearish pattern. Disney stock price has gone far away from the key moving averages. So, the pullback rally may be active from the lower levels.
Disney (NYSE: DIS) stock fell for 12 consecutive months. It returned back to its lower level. The next few sessions will be interesting to see how the DIS prices react near the support levels. The technical analysis suggests prices look oversold. However, bulls tried multiple times to break the higher range and expand upward.

Moreover, due to the strong presence of sellers, prices faced rejection. It shows sellers are still active on higher levels.
Disney share (NYSE: DIS) price is in a correction phase but trading near to crucial support of $80. If formed, a bearish candle indicates bears are active and will try their best to lower stock prices more.
DIS price closed the previous session at $84.28 with an intraday rise of -0.14%. If the bulls succeed in defending the $80 support, then the possibility of a bounce back will increase. However, if the sell-off continues and Disney stock drops below $80, then a 5% to 10% more downfall is possible.
Technical Analysis: Will Disney Stock Price Rebound From Lower Levels?
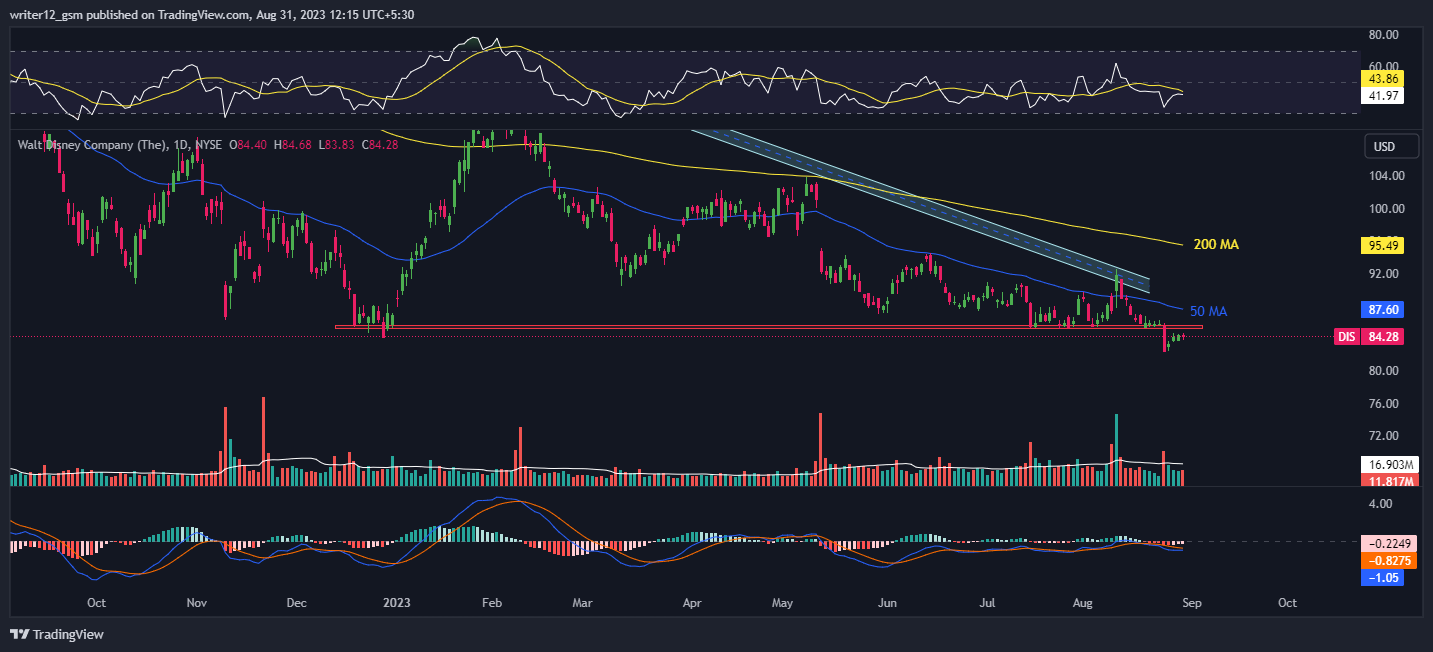
Disney’s price is trading below the downward-sloping 50-day and 200-day EMA showcasing a downtrend. However, the Disney stock price has gone far away from the EMAs. Due to this, bulls might come forward to push the prices higher. Unfortunately, the attempt was not successful and prices witnessed sharp rejection from the resistance zone.
However, if more selling volume adds up then the price might conquer supporting SMA’s by making lower highs and lows. Hence, the DIS price is expected to move downwards giving bearish views over the daily time frame chart.
The current value of RSI is 41.97 points. The 14 SMA is above the median line at 43.86 points which indicates that the Disney stock is bearish. The MACD generated a negative crossover and the histogram is also red indicating bearishness. The RSI denotes weakness but is near the oversold territory.
Summary
Disney (NYSE: DIS) technical oscillators also support the bearish trend. The MACD, RSI, and EMA are emphasizing negative signs and imply that the downtrend may continue in the DIS stock price. Disney price action suggests that the investors and traders are bearish on the 1-D time frame. DIS price action reflects a bearish perspective at the moment.
Technical Levels
- Support Levels: The most immediate support levels for the Disney stock price are $82.54 and $76.75
- Resistance levels: The most immediate resistance levels for the DIS stock price are $91.51 and $94.12
Disclaimer
The evaluation provided in this article is for informational and educational purposes only. Do not rely on this information as financial, investment, or trading advice. Investing and trading in stock involves risk. Please assess your situation and risk tolerance before making any investment decisions.
Steve Anderson is an Australian crypto enthusiast. He is a specialist in management and trading for over 5 years. Steve has worked as a crypto trader, he loves learning about decentralisation, understanding the true potential of the blockchain.


